
If you want to decode the secrets to mobile app success in today’s fast-paced competitive market, then you must dive into the latest mobile app industry statistics.
It has been only a decade since the mobile app revolution began. And today, it has become one of the high-grossing industries in the world.
Just see, out of the 8 Billon current global human population, 6.92 Billion people are smartphone users. It means, 85.95% of the world’s population uses mobile apps.
Fascinating isn’t it?
This is because of massive smartphone penetration and digitalization across all industries and business practices. Today, mobile apps have acquired space among the most essential commodities. For businesses, this skyrocketing growth of the mobile apps market is undoubtedly alluring. However, as the demand for more mobile apps is increasing, the competition is also getting more challenging than ever.
Business stakeholders invest a great amount in building and maintaining mobile applications. Marketers do tons of research to craft effective strategies for making their apps successful in the market. But, despite all such big efforts, they often fail to achieve their business goals. And even sometimes struggle to find the keys to penetrate the competition.
Therefore, it is extremely important to stay updated with the latest trends and statistics. After all, it is the data that unlocks the hidden formulas. Since we are an experienced mobile app development company, we know how critical a role mobile app statistics play.
To help you with this, our team conducted thorough research and collected highly important and exciting mobile app industry statistics. In this post, we have shared detailed and insightful information about what trends are happening in the mobile app industry and how this data can help you make a good decision for the future.
Table of Contents
Overview of the Current Mobile App Industry
The mobile app industry is getting bigger and bigger. As the production of featured smartphones and app users is increasing, the demand for apps is skyrocketing. According to Statista, the global mobile app market is estimated to reach $756 Billion by 2027 at a CAGR of 8.58% during 2022-2027.
Consumers look for innovative and feature-rich apps for various purposes. This, as a result, has broadened the business scope for launching more user-centric apps. Startups, small businesses, SMEs, and enterprises are significantly investing in mobile app development to build customer-orientated apps. Here are the general statistics and insights about the mobile app industry:
- The global mobile app market is projected to attain $756 Billion by 2027 at a CAGR of 8.58.
- Global consumer spending on mobile applications has touched $129B as of 2022.
- During 2019-2020, more than 250 million mobile apps were downloaded daily.
- The global mobile app development market size is poised to attain $583.03 Billion value at a CAGR of 12.8% during the 2022-2030 period.
- There are a total of 5.7 million apps on the Google Play Store and Apple App Store.
- On average, smartphone users spend around 4-5 hours a day using mobile apps.
- China and India are the top countries that have the highest number of mobile app users.
(Source: Statista, Business of Apps, Sensor Tower)
Looking for the latest mobile app industry insights?
The mobile app industry evolves rapidly. For the most recent 2026 statistics, market insights, and growth forecasts, visit our comprehensive updated report:
Mobile App Revenue Statistics
Mobile apps have turned into one of the top methods for generating revenue. By merely launching a mobile application, you can earn millions and billions of revenues and profits. Honor of Kings, Genshin Impact, and PUBG Mobile alone are famous mobile gaming apps that are making billions of dollars through in-app revenue. Besides gaming, TikTok, YouTube, Google One, and Tinder are non-gaming mobile apps that have made revenue in Billion dollar figures. So, this certainly sounds good and lucrative for businesses looking to invest in mobile app development services. And statistics also show positive signs about its future growth.
- Total mobile advertising in 2022 touched $336B with a 13.8% increment as compared to last year.
- Mobile games accounted for 63% of consumer app spending in 2022 and contributed $37.3 Billion.
- App subscription revenue reached $17.1B in 2022. iOS alone was responsible for 77% of this revenue.
- iOS and Android app consumer spending decreased to $129 Billion in 2022, which is a 3% downfall year-on-year.
- Total revenue in the mobile app market is projected to reach $756 Billion at a CAGR of 8.58% between 2022-2027.
- The average revenue per download is currently projected to gain $2.02.
- In global comparison, China takes the lead in terms of generating the most app revenue ($167B in 2022).
(Source: Statista, Business of Apps)
Revenue of Apps on the Google Play Store
Google Play witnessed a significant increment in consumer spending on apps between 2021-2022. It gained an increment of 58.2%. In 2022, this figure was lower, around 8.4&, with total revenues of $11.5 Billion for the year. Source
Revenue of Apps on the Apple App Store
The iOS app market has reported impressive growth. App revenues on iOS grew by 10.6% in 2022 to $36.3 Billion. Interestingly, iOS contributed the maximum revenue share of 75% of total consumer spending on apps last year. Source
Country-Wise App Revenue Statistics
China, Japan, and the USA lead the global mobile app revenue market by acquiring the highest share. However, other countries are also contributing a considerable amount in total app revenues.
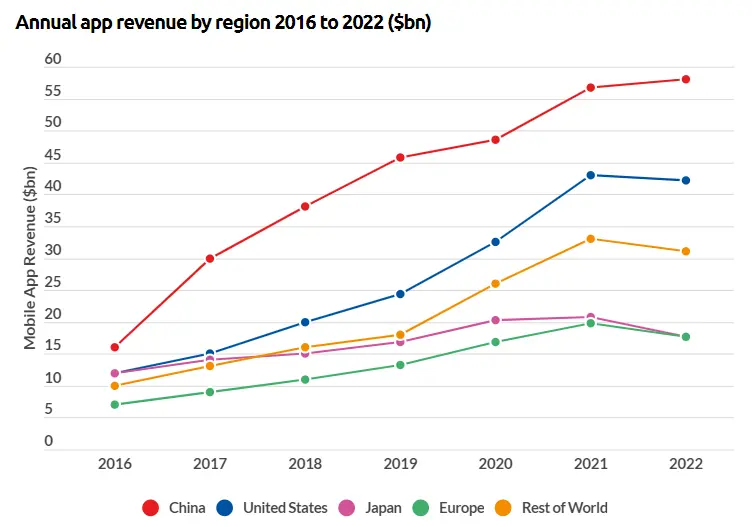
(Source: Business Of Apps)
Industry-Wise Revenue of Mobile Apps Worldwide
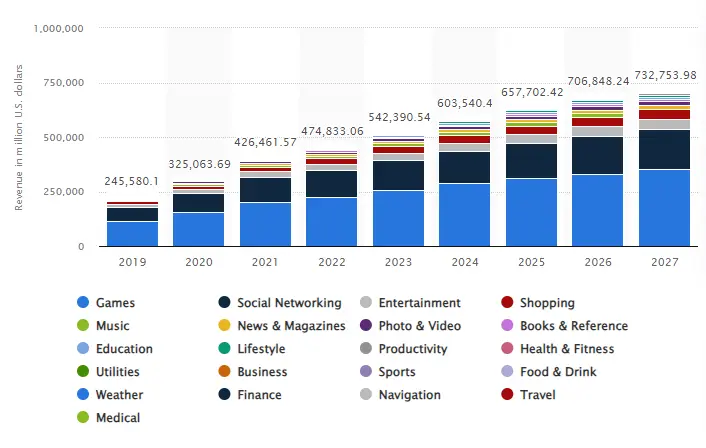
Source: Statista
Revenue of Gaming Apps
Mobile gaming is responsible for the highest share of the entire global mobile app revenue. However, as compared to previous years, consumer spending on mobile games decreased by 9.2% in 2022. But despite this downfall, business people are optimistic about its increment.
Most Popular App Monetization Methods in 2023
In the USA mobile app industry, significant app revenue comes from in-app ads. And also globally, in-app is the most preferred mobile app monetization method of app publishers.
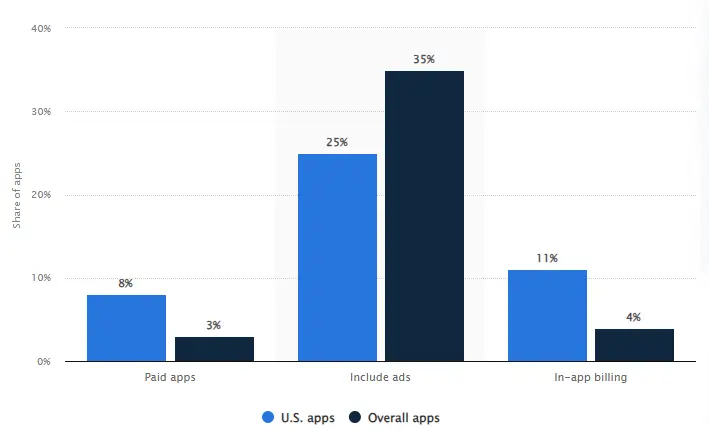
(Source: Statista)
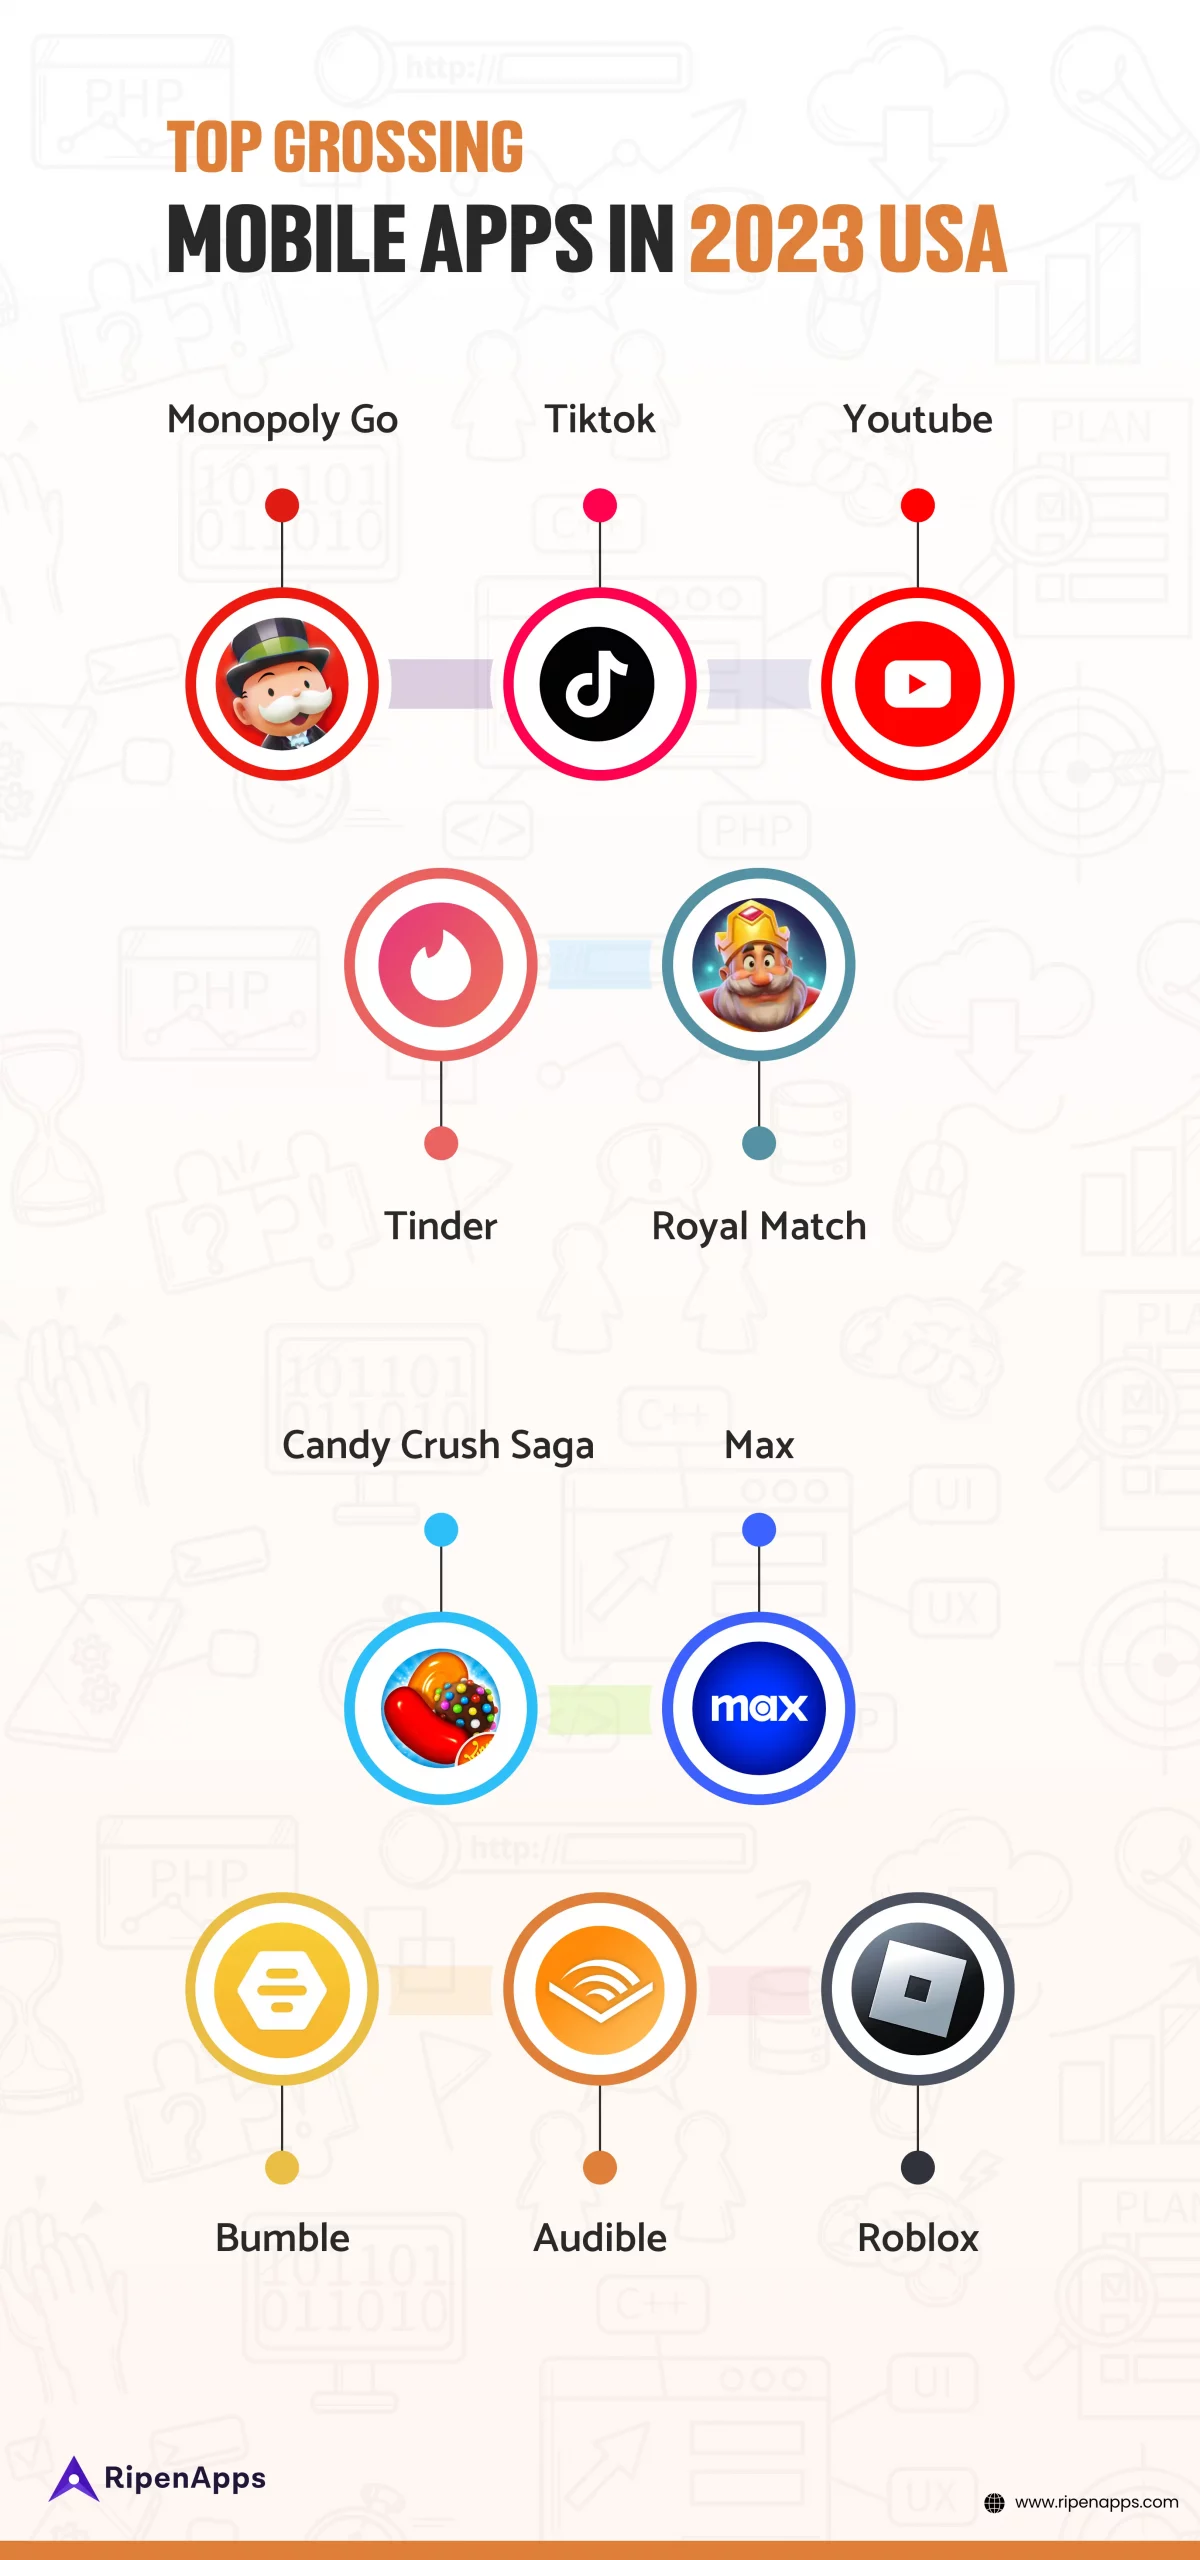
Top-Grossing Apps in 2023
If you develop a mobile app with innovative features you might become a billion-dollar company. Many startups turned into Unicorn companies with constant improvement in their app revenue. This is because of the drastic need for innovative and more consumer-friendly apps. Generally, gaming apps lead the entire mobile app market share. But interestingly, TikTok was the top-grossing mobile app in 2022. It generated $2B in-app revenue. While Honor of Kings was the top-grossing mobile game in 2022. So, let us see what other apps in different categories generated high revenue last year.
Mobile App Downloads Statistics
Currently, there are 8.93 million apps worldwide. Out of that, 3.553 million apps are on Google Play Store and 1.642 million on the Apple App Store. If you are curious to know how many apps are downloaded a day, there were around 250 million app downloads daily last year. And which is now expected to increase. As businesses are releasing new apps for different use cases, the number of app downloads is also gaining good traction.
- Google Play contributed 110.1 Billion downloads in 2022. Whereas, iOS acquired 32.6 Billion app downloads.
- Chinese smartphone users downloaded the most number of apps, followed by India and the USA.
- 142.6B apps and mobile games were downloaded last year. However, it witnessed a 0.6% downfall as compared to its previous year’s downloads.
- The number of app downloads worldwide has enhanced by 63.5% between 2016-2021.
(Source: Business of Apps, Zippia)
Statistics of iOS App Downloads
The iOS app store reported an increment in its downloads. There were 600 million more app downloads as compared to the previous year. In 2022, there were 24.3 Billion app downloads on the iOS app store. According to 42matters, there are 1,804,552 apps currently running on the Apple App Store in 2023. On average, 1,223 apps are released on the Apple App Store every day. (Source: 42Matters)
Statistics of Android App Downloads
Google Play reported a downfall in downloads by 2.6% last year. The total app downloads on Google Play Store declined from 64.6B to 62.9B downloads. When it comes to the download distribution of apps, free apps still take over paid apps.
Free Apps vs Paid Apps
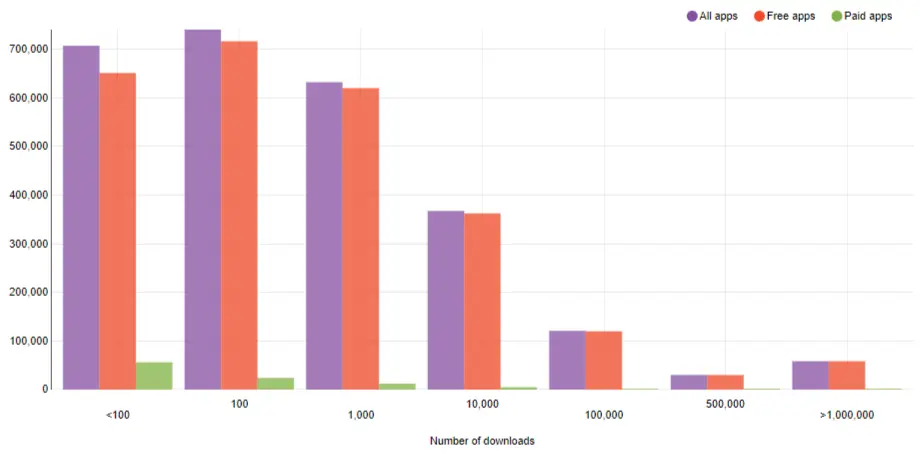
(Source: AppBrain)
Country-Wise Total Number of App Downloads
When it comes to the highest number of app downloads, China and India bag the top positions. And this is obvious since these two countries have the most significant number of smartphone users globally. However, China still stands out first in terms of high downloads-per-capita.
| Country | Downloads (Billion) |
| China | 98.3 |
| India | 26.6 |
| USA | 12.1 |
| Brazil | 10.3 |
| Indonesia | 7.3 |
| Russia | 5.5 |
| Mexico | 4.8 |
(Source: Business Of Apps)
Most Popular Mobile Apps in 2023: Which is the Top-Performing App?
TikTok continues its popularity in the global mobile world. TikTok app was the most downloaded app in 2023 having over 3 billion downloads. And Subway Surfers was the most downloaded mobile game having 304 million downloads.
Most Popular Apps in 2023 Worldwide
Besides TikTok’s dominance in terms of popularity, many other apps still possess great popularity and reputation. Interestingly, three apps in the top five are from Meta (Facebook).
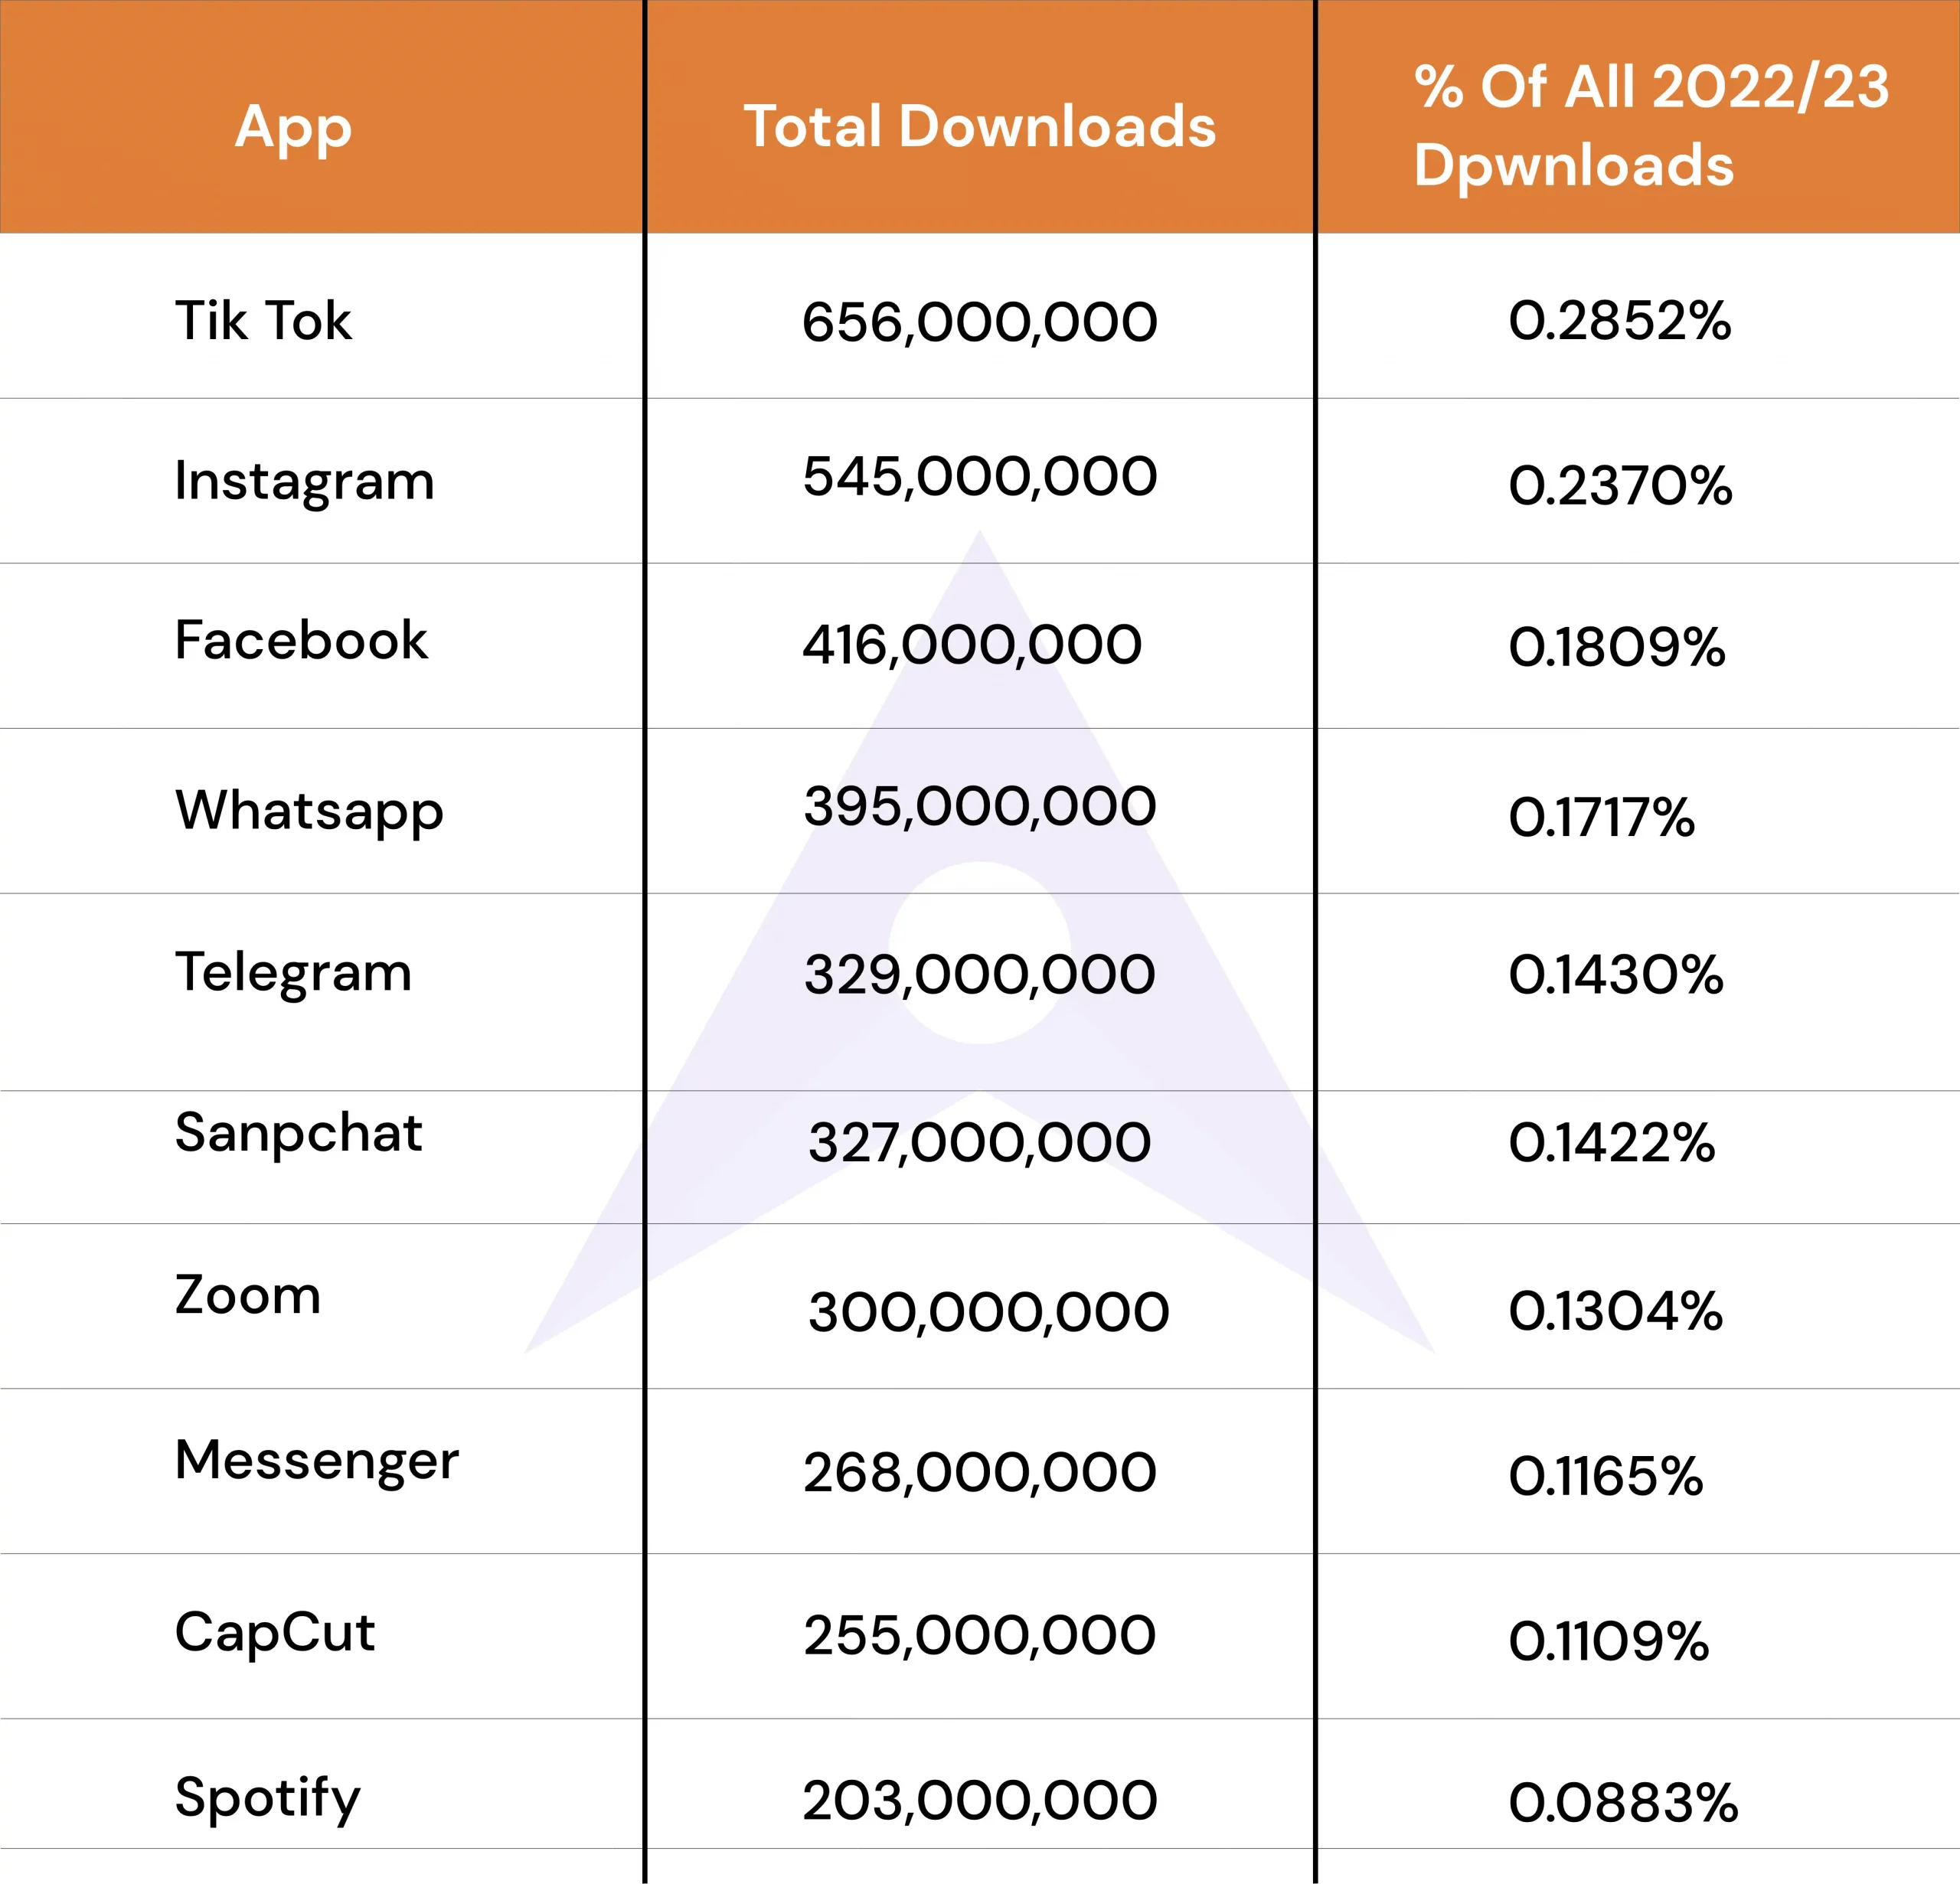
(Source: BankMyCell)
Most Popular Apps in USA 2023
- Temu
- SHEIN
- TikTok
- Max
- Snapchat
- Cash App
- Telegram
- Messenger
(Source: 42Matters)
Most Popular Apps in India 2023
- JioCinema
- PhonePe
- Meesho
- Flipkart
- Shopsy
- Snapchat
- WhatsApp Business
- WhatsApp Messenger
- Telegram
(Source: 42Matters)
Most Popular iOS Apps in 2023
| App | Downloads (Million) |
| TikTok | 212 |
| YouTube | 133 |
| 127 | |
| CapCut | 113 |
| 103 | |
| GoogleMaps | 98 |
| Google One | 89 |
| Kwai | 78 |
| Snapchat | 75 |
| 75 |
Most Popular Android Apps in 2023
| App | Downloads (Million) |
| TikTok | 460 |
| 455 | |
| 297 | |
| Snapchat | 255 |
| CapCut | 244 |
| Telegram | 244 |
| 223 | |
| Subway Surfer | 198 |
| Messenger | 167 |
| Stumble Guys | 158 |
Mobile App Usage Statistics
Mobile applications are used for various purposes. From business to consumer, every user segment utilizes a variety of apps for different activities and goals. At present, people spend most of their time using apps. On average, the user uses apps between 4-5 hours. New mobile app development trends and innovations are also impacting the user’s behavior in using apps. So, let us see the current app usage statistics in different categories.
App Usage Key Statistics
- There are 6.9 billion smartphone users around the world as of 2023
- Android users spend over 90% of their mobile time using apps
- Consumers spend over 4-5 hours a day on mobile apps
- South Koreans spend the most time using YouTube
- Gen Z is most likely to use crypto trading apps
- Only 8% of B2B marketers use mobile apps for content distribution
(Source: Statista, Senor Tower, Business of Apps)
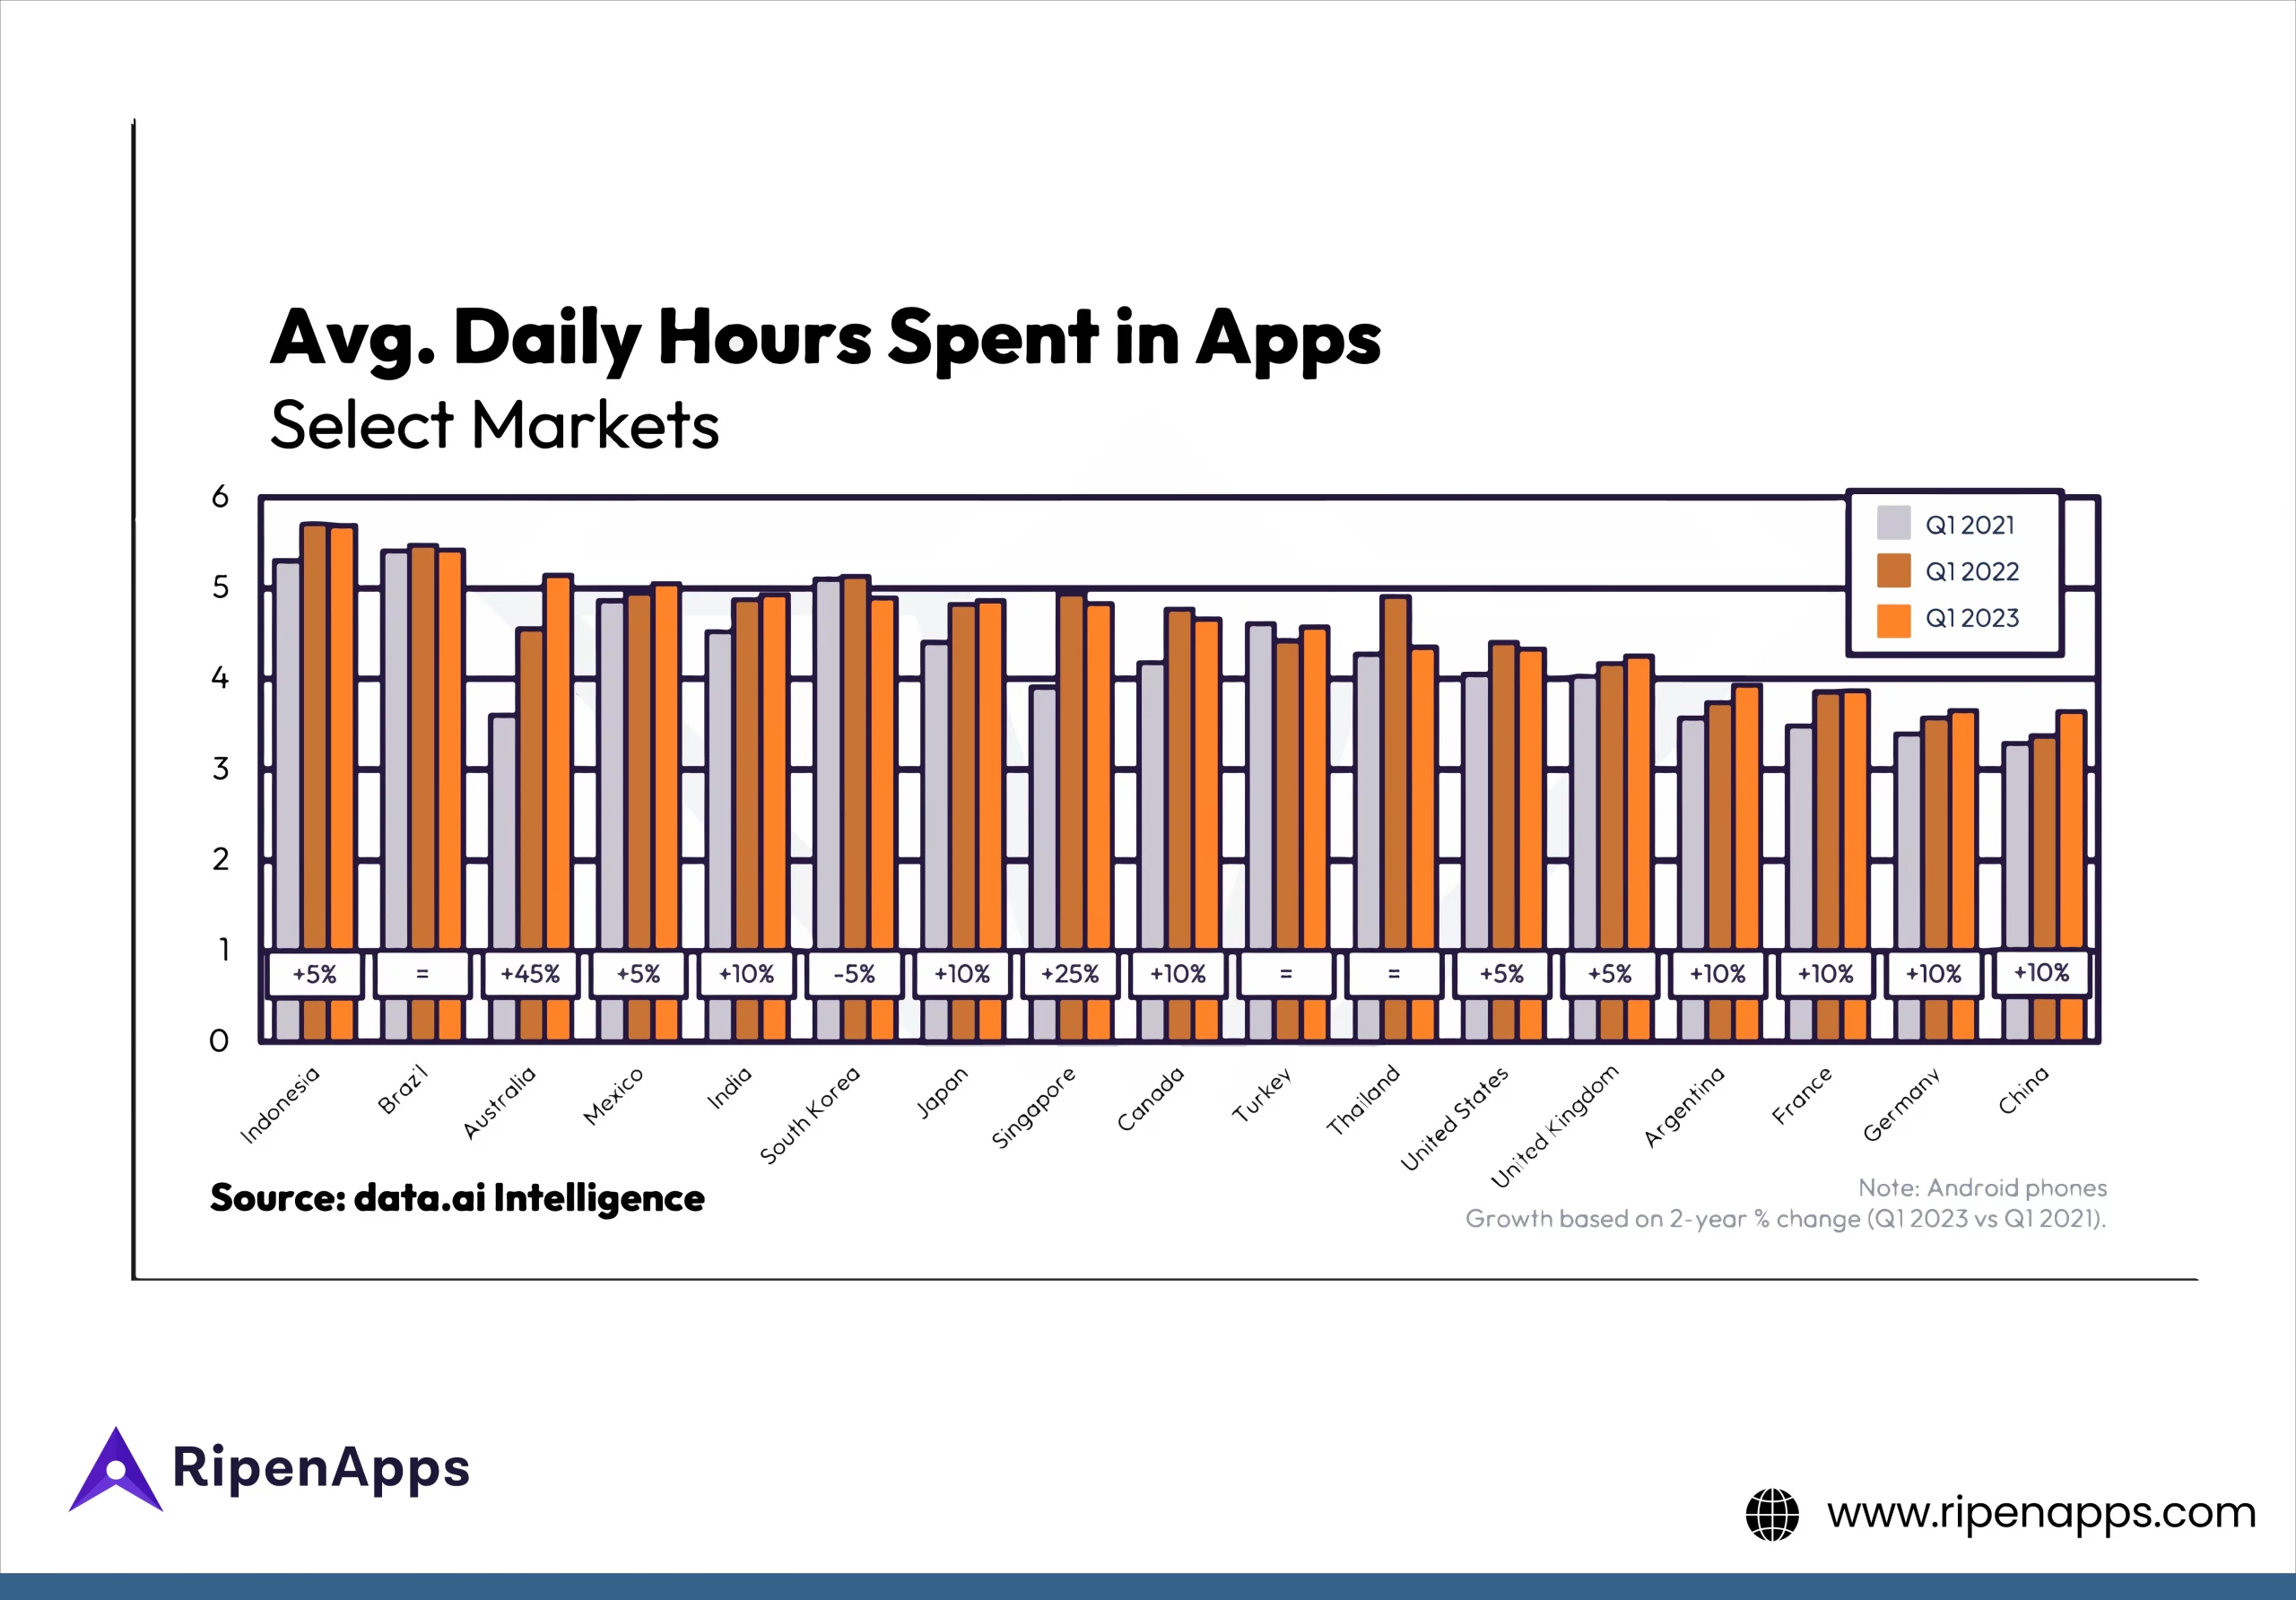
Country-wise Average Daily Time Spent on Mobile Apps
When it comes to which country spends the most time in apps, Indonesia comes on the top, followed by Brazil, Saudi Arabia, and Singapore. However, it is interesting to note top countries like the USA, China, and India have relatively less time spent on apps.
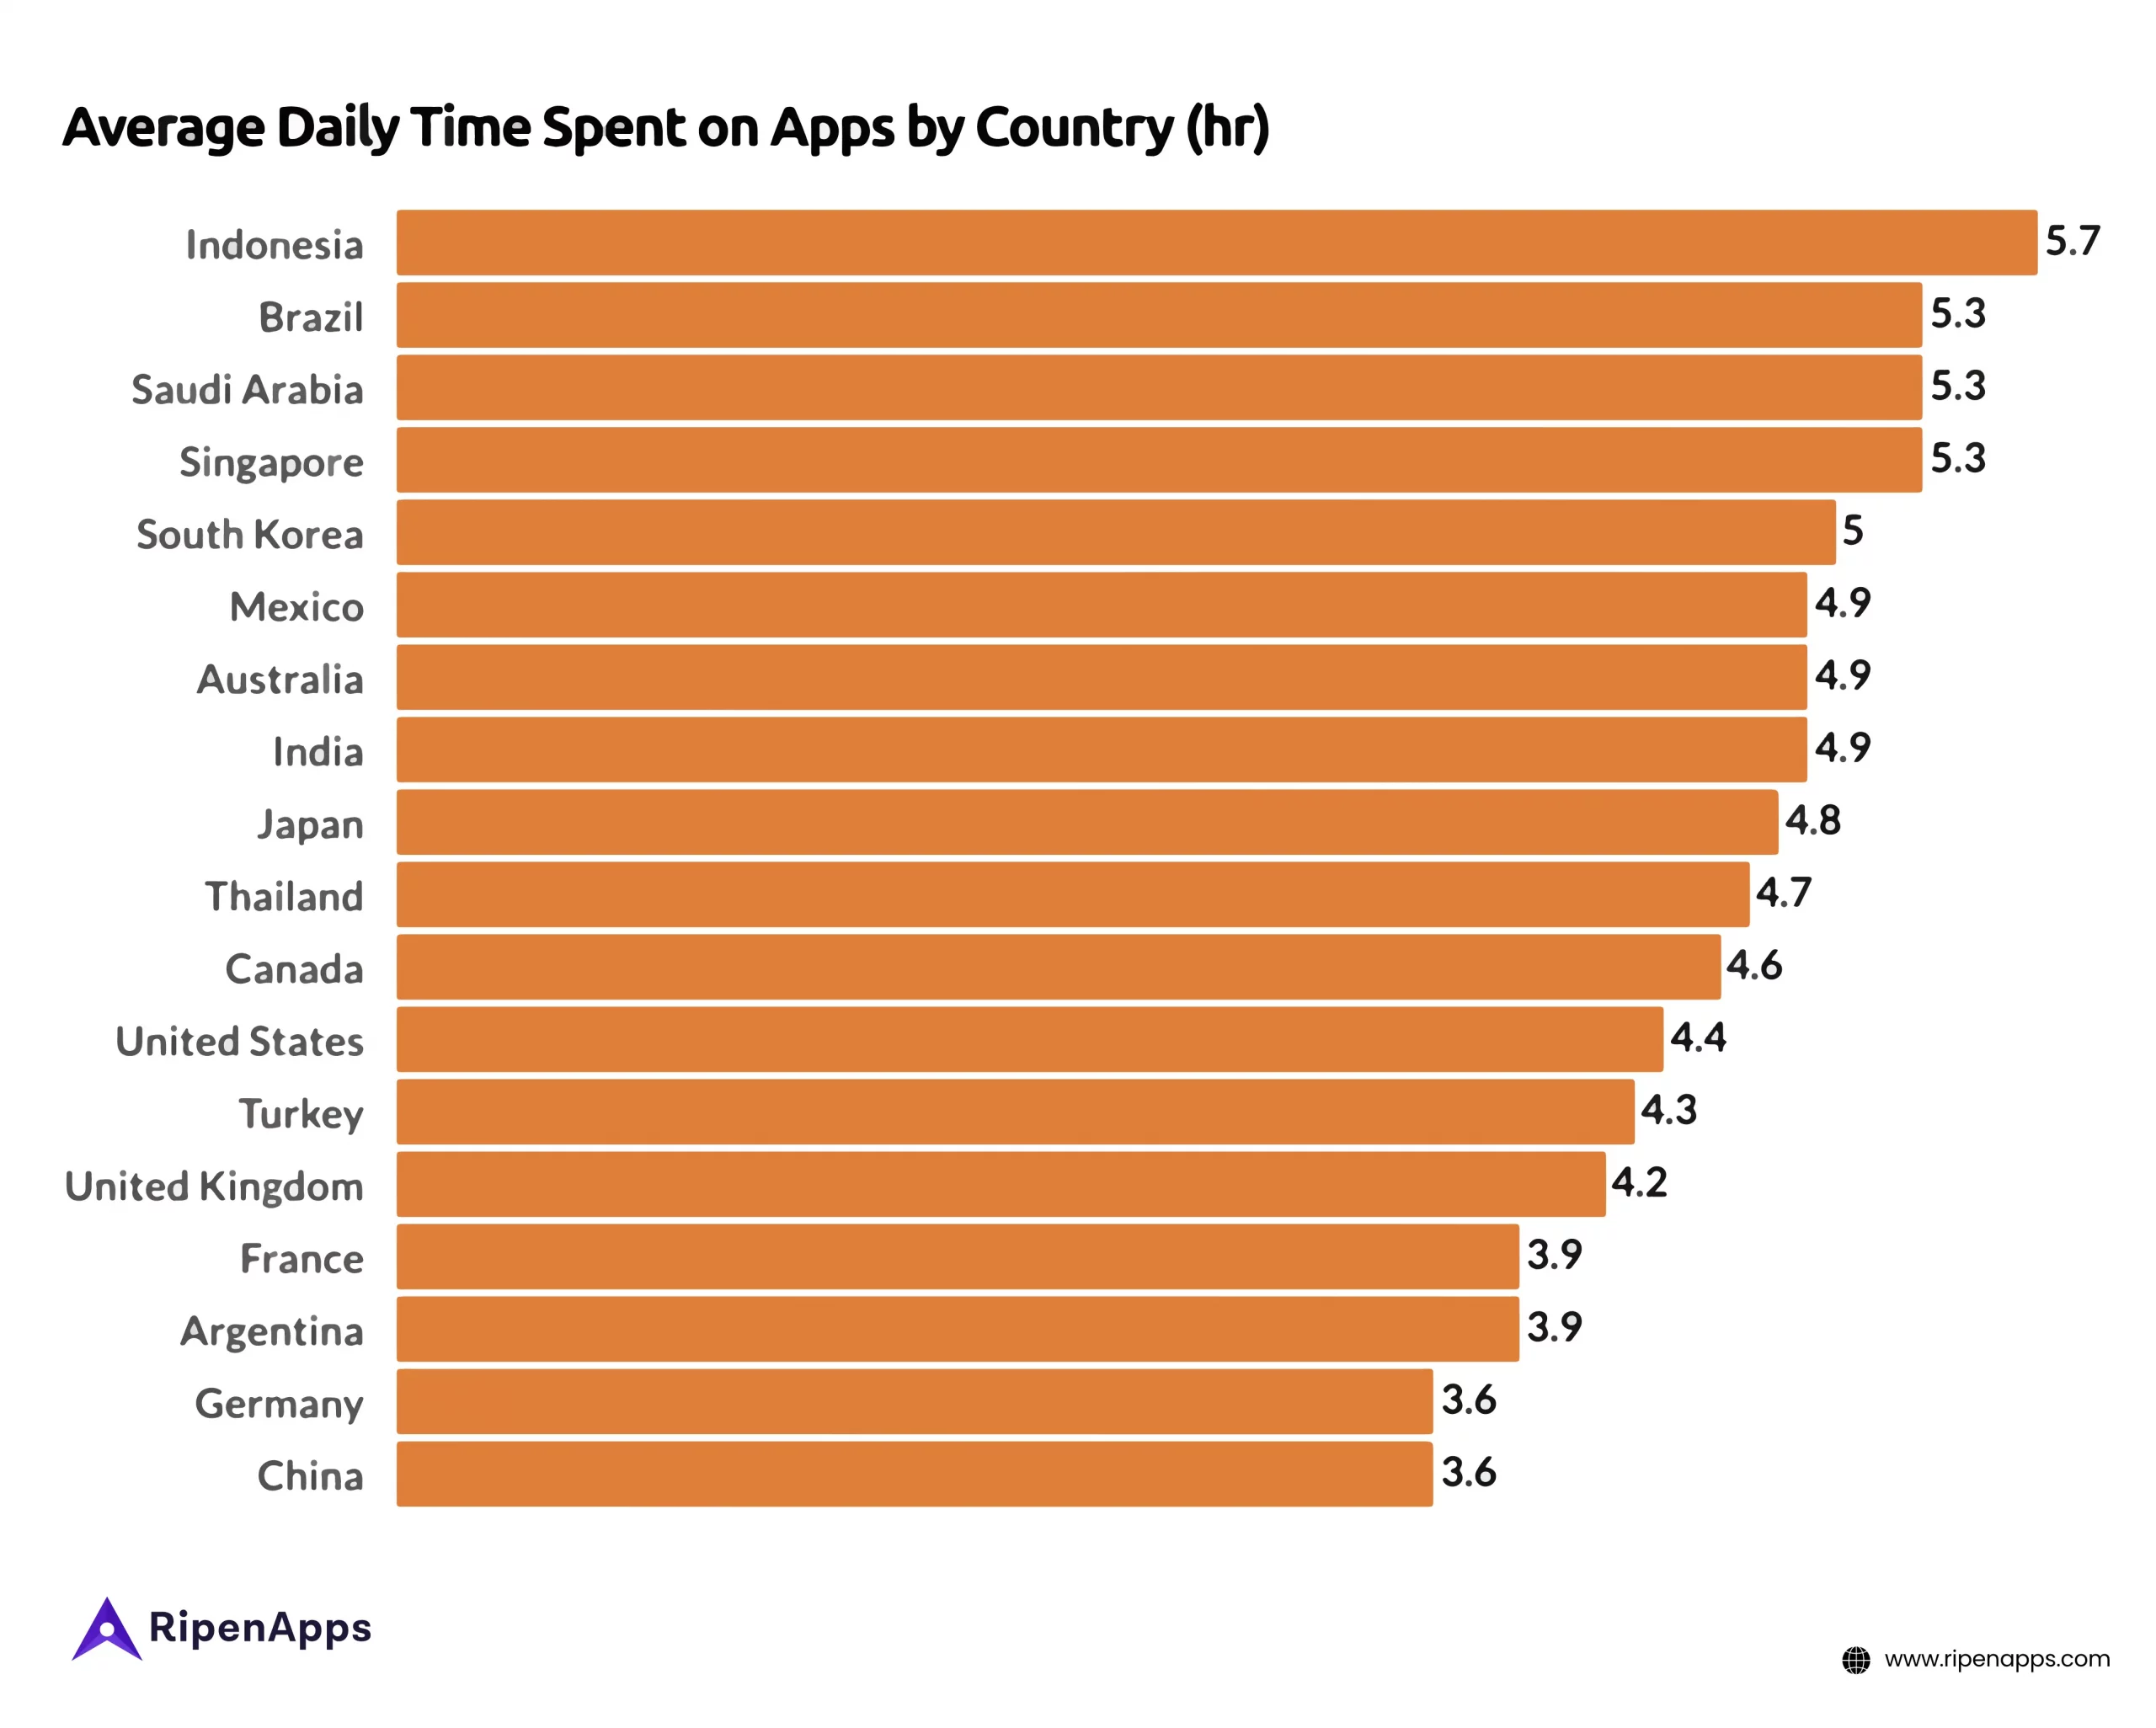
(Source: Data.ai)
Time Spent Per Day on App Category in 2023
(Source: Data.ai)
Top Mobile App Activities
As per the latest market statistics, smartphone users mostly use apps for messaging and social communication. Then, emailing, online banking, listening got music, and watching videos are the most popular smartphone user activities during 2022-2023.
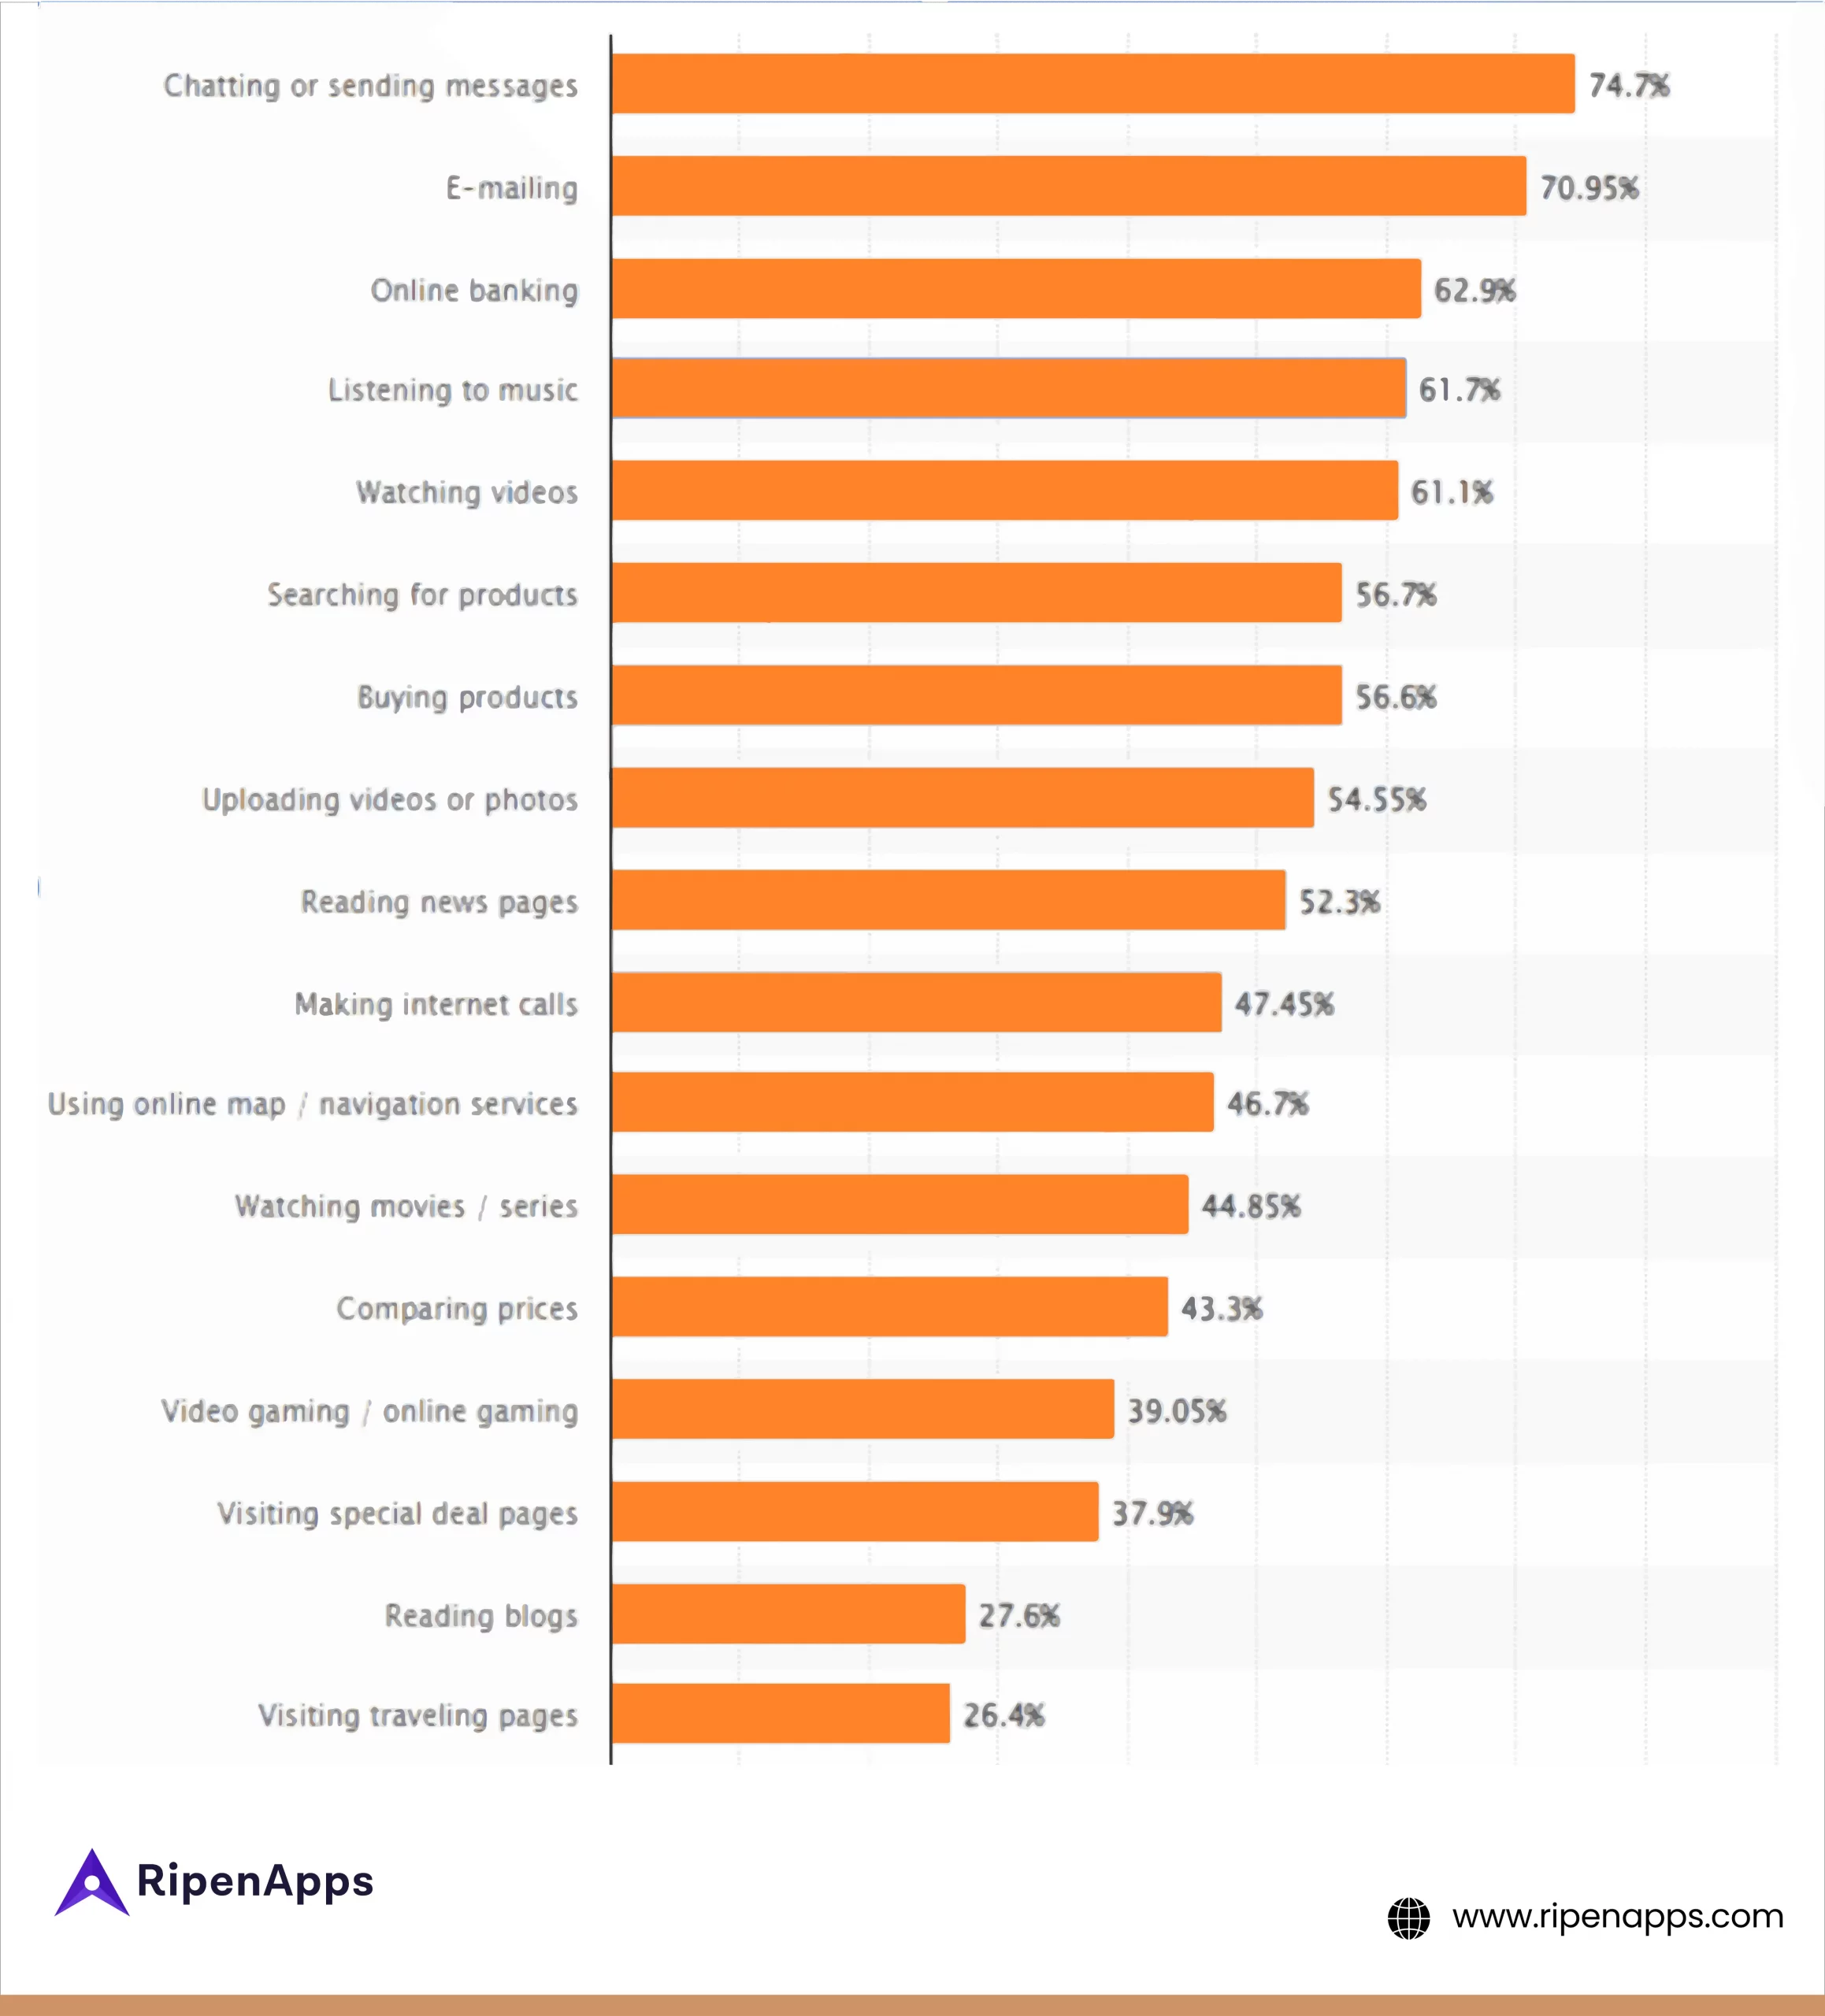
(Source: Statista)
App Store Statistics
App stores are the launching pads of mobile apps. Google Play, Apple, Windows, Amazon, and Huawei are the popular app store for publishing mobile apps. However, Google Play and Apple App Stores are predominant players in the mobile app market. Both are the leading platforms and preferred choices for app publishers as of 2023.
Apple App Store Statistics
At present, the Apple app store has nearly 2 million apps. Out of this, free apps alone make up 94.1% of the Apple App Store. On average, around 36,000 apps were published on the Apple App Store in June 2023. Go through the below Apple app store statistics
Total Number of Apps on Apple App Store as of 2022
| Year | Number (Million) |
| 2017 | 2.11 |
| 2018 | 2.02 |
| 2019 | 1.88 |
| 2020 | 1.82 |
| 2021 | 1.79 |
| 2022 | 2.18 |
(Sources: 42matters, PocketGamer, App Data Report)
Google Play Store Statistics
Google is the leading platform for launching Android apps. At present, Google Play Store has over 3.5 million apps for Android users. Gaming, education, and business apps are the most popular app categories. Take a look at the latest Google Play Store statistics.
Total Number of Apps on Google Play Store as of 2022
| Year | Number (Million) |
| 2017 | 3.5 |
| 2018 | 2.61 |
| 2019 | 2.81 |
| 2020 | 2.93 |
| 2021 | 2.78 |
| 2022 | 2.65 |
(Source: AppBrain, App Data Report)
Most Popular Google Play Store App Categories
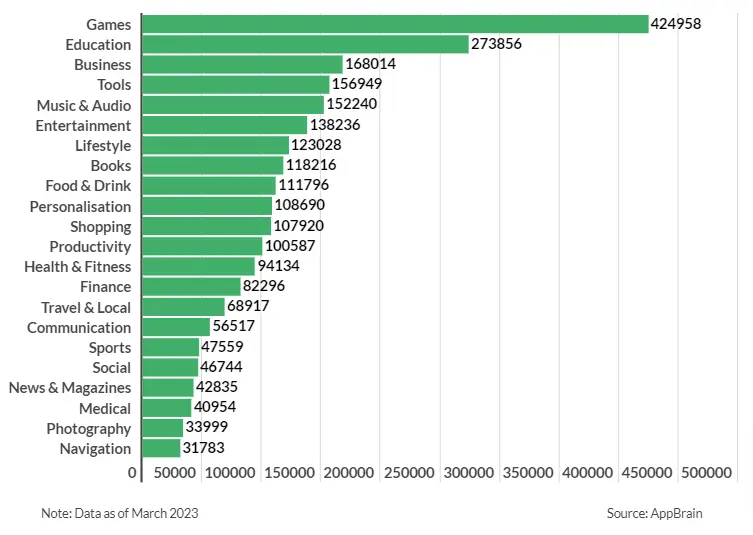
(Source: Business Of Apps, AppBrain)
Conclusion
The current mobile app industry is experiencing dramatic changes. Whether it is user or business, both segments are witnessing considerable improvements in various aspects. Based on the above mobile app industry statistics, the current market continues to grow at an impressive speed.
And its future also shows positive signs. It means startups, entrepreneurs, and businesses will have more opportunities to leverage the power of mobile app technology. However, marketers and stakeholders should deeply analyze these statistics.
This would help them to craft better development and marketing strategies. And this is where RipenApps comes in. We can assist you to develop a market-ready mobile app while leveraging the latest industry trends. You can also seek help from a globally recognized mobile app development company in USA to get a complete roadmap.
This would help them to craft better development and marketing strategies. And this is where RipenApps comes in. We can assist you to develop a market-ready mobile app while leveraging the latest industry trends.


SHARE
WRITTEN BY
Ishan Gupta
CEO & Founder
Ishan Gupta is a seasoned entrepreneur and CEO with extensive 8+ years of experience in business and mobile app development landscape. He believes that the right digital product allows companies to focus on what they do best, while technology handles the rest. With deep exposure to global markets, he understands what makes an app succeed. His approach translates business needs into clear product strategies, ensuring that every feature contributes to measurable ROI.
View All Articles


 India
India USA
USA Australia
 Canada
 UK
UK UAE
UAE