
Key Takeaways
- Web app development ROI is a business metric that measures revenue, efficiency, and long-term digital transformation impact.
- Web application development cost must be evaluated alongside business impact, not as an isolated budgeting exercise.
- ROI depends on three buckets: revenue generation, cost reduction, and risk mitigation across different business models.
- Hidden costs like technical debt, maintenance, and compliance can significantly reduce long-term web application ROI performance.
- Strong ROI outcomes depend on UX quality, tech stack decisions, and execution speed, not just initial development cost.
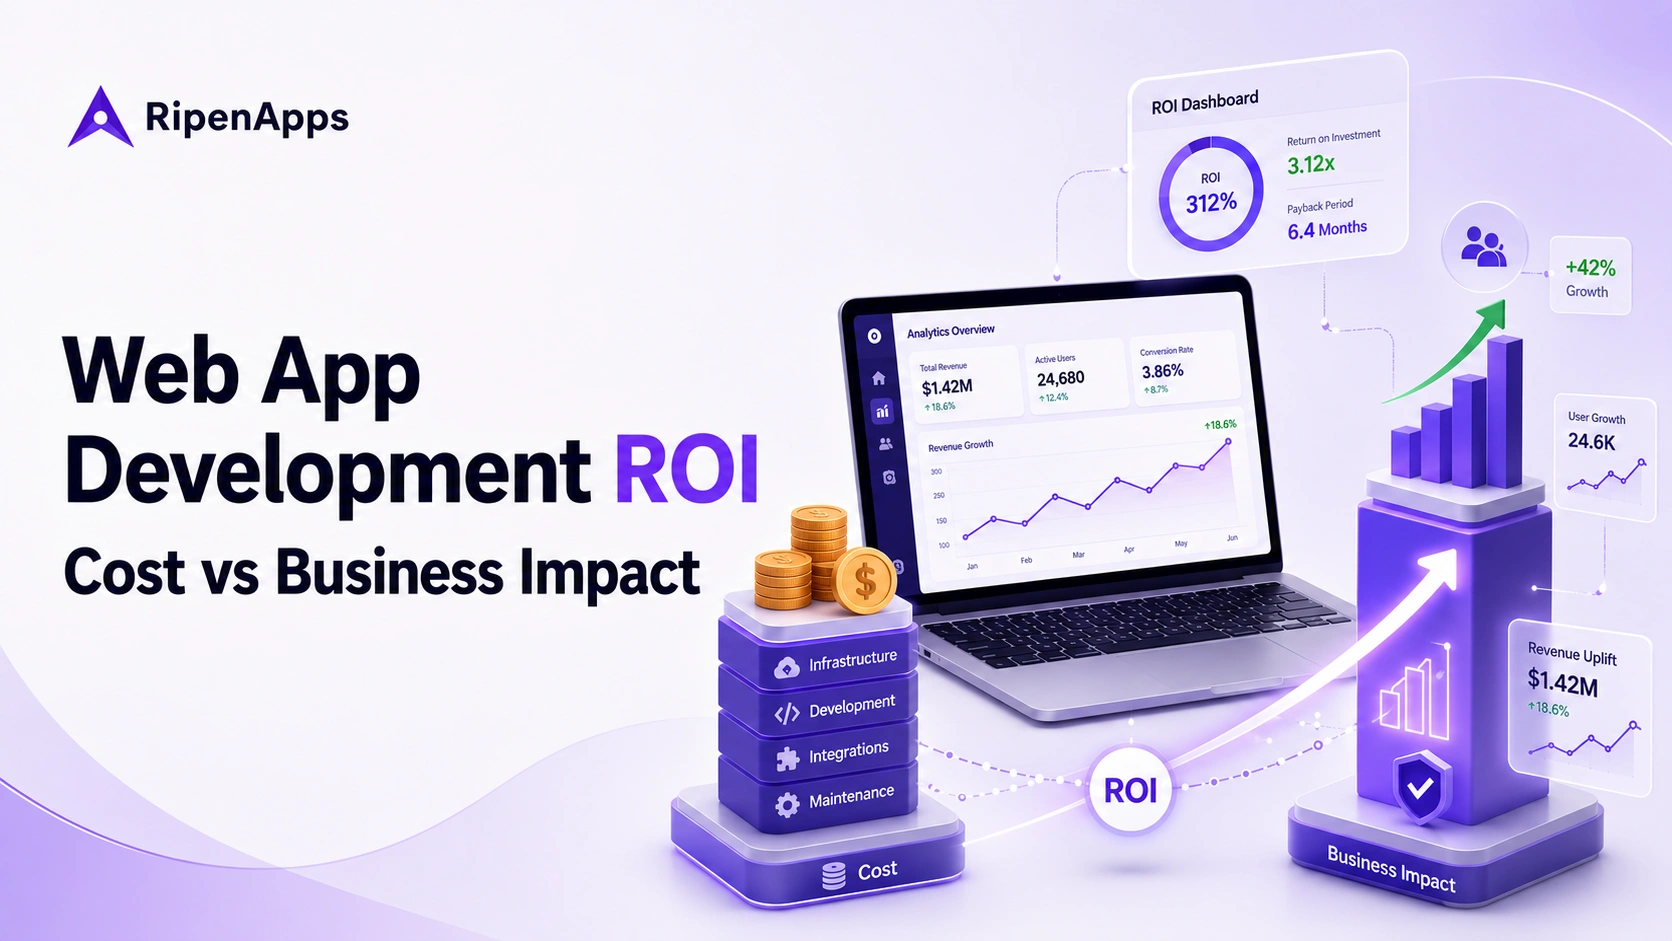
Web app development ROI is not a technical metric. It is a business outcome measure that determines whether your digital product becomes a cost center or a revenue engine. Most businesses still evaluate web app development cost as a line item instead of a strategic return driver, which leads to incomplete investment decisions.
Most budget conversations start with “how much does it cost?” and stop there. That is the wrong question. Cost is an input. The right question is: what does this investment return, and by when? A $50,000 web app that generates $200,000 in Year 1 revenue is not an expense. A $200,000 build that generates nothing is not an investment. The math is simple. The framework most businesses use to get there is not, and that is exactly what this guide provides.
This guide reframes web application development cost as an investment equation, not an expense sheet. You will learn how ROI of web application development is calculated, what drives it, and how digital transformation ROI translates into revenue growth, operational efficiency, and competitive advantage. Whether you’re evaluating a web application development agency or exploring other development services for a new digital product, understanding ROI is the difference between building software and building a scalable business model.
Table of Contents
Web App Development ROI: What Does It Actually Cost vs. What Does It Return?
Web application development cost is not the final question. It is the input variable in the ROI equation. Understanding cost structure helps businesses model payback period, digital transformation ROI, and long-term scalability.
Modern web application development is no longer limited to creating online portals or dashboards. Businesses now invest in customer-facing platforms, internal productivity systems, SaaS products, and digital ecosystems designed to generate measurable ROI. Understanding development costs is the first step toward evaluating long-term business impact.
Cost by App Type
Web app development cost varies significantly depending on complexity, infrastructure, and scalability requirements.
Different types of web applications for businesses require varying levels of investment, infrastructure, and scalability. A simple informational platform has a very different cost profile than an enterprise-grade SaaS solution or customer self-service portal. Understanding these categories helps organizations estimate both development costs and potential ROI.
Here is a table for your convenience:
| App Type | Typical Cost Range | Primary Use Case |
| Static Web Apps | $3,000–$10,000 | Landing pages, informational platforms |
| Dynamic Web Apps | $10,000–$25,000 | Dashboards, SaaS MVPs |
| Enterprise Web Apps | $50,000–$500,000+ | ERP systems, fintech platforms, large-scale SaaS |
According to Softermii, enterprise-grade applications often exceed early estimates due to scalability, integrations, and compliance requirements.
However, cost alone does not determine success. A poorly architected $10,000 app can underperform a $200,000 system if it fails to deliver ROI through conversion rate improvement or operational efficiency.
Cost by Team Model
Team structure significantly influences web application development cost breakdown.
A senior engineer in the U.S. may cost $150–$250/hour, while equally skilled talent in Eastern Europe or Latin America ranges between $40–$80/hour, according to Software Orca.
This creates a 40–60% variance in total project cost. However, lower cost does not always equal higher ROI. Delayed delivery or rework can extend the web app development timeline and cost, reducing overall ROI of software development.
The Budget Items Most Founders Overlook
Most businesses underestimate the total cost of ownership (TCO). Beyond development, ongoing expenses significantly affect ROI.
According to Statista, annual software maintenance costs consistently run at 15–20% of the original development investment, a figure confirmed across multiple enterprise software analyses.
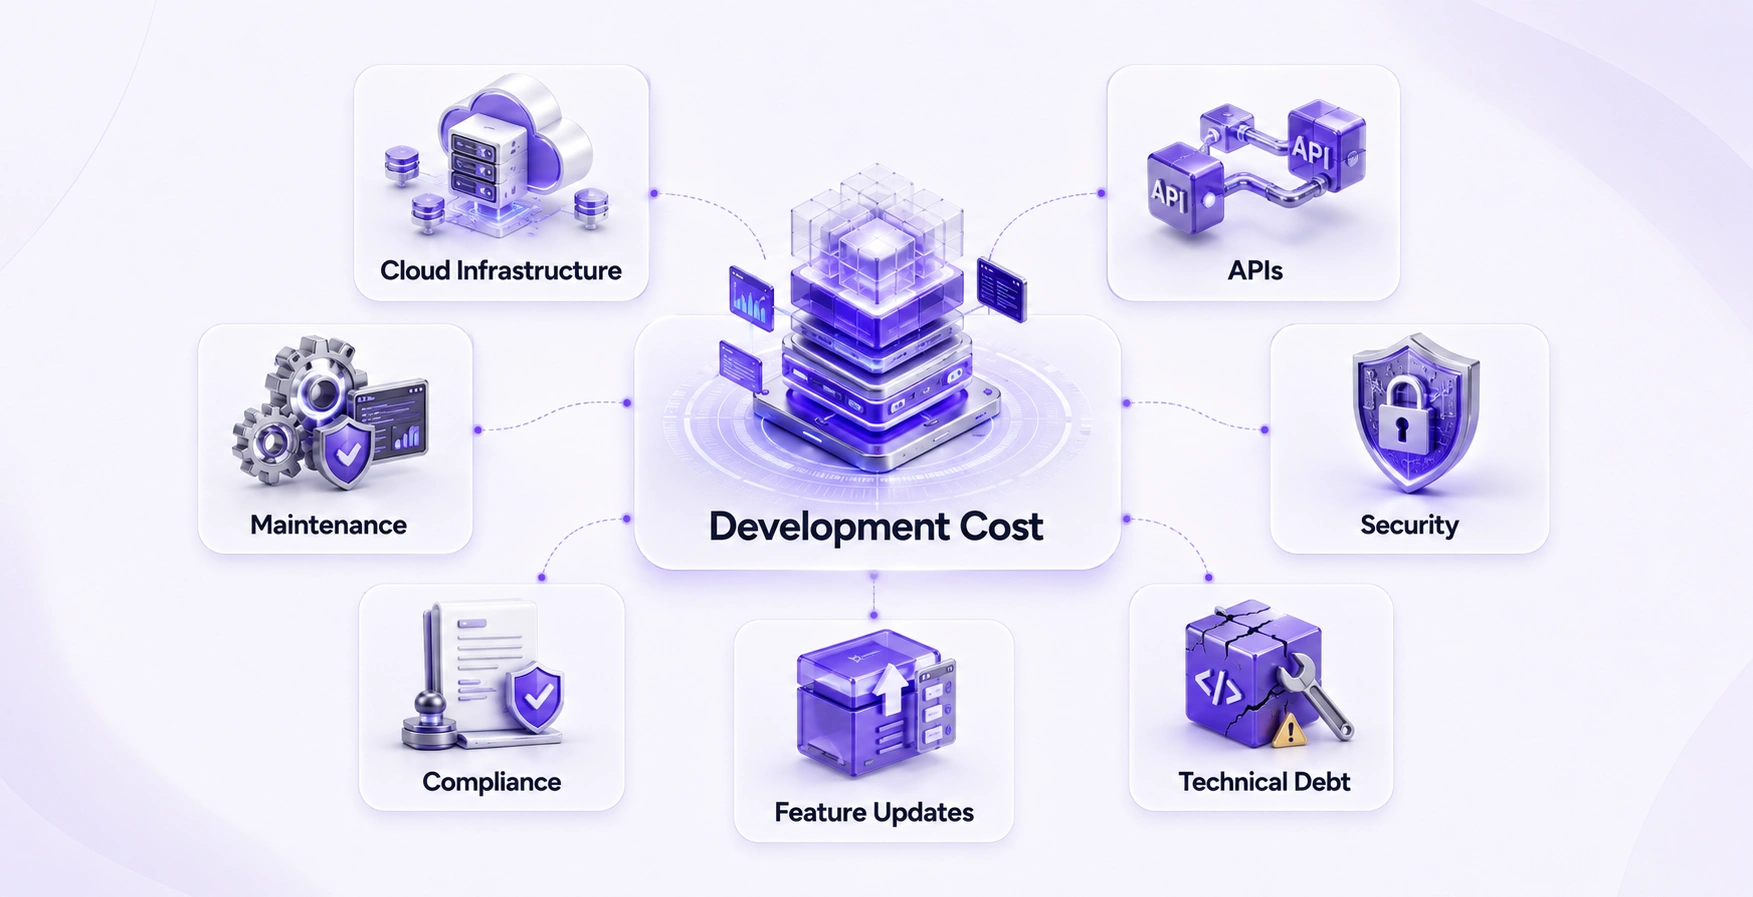
Key overlooked costs include:
- Cloud hosting and scaling infrastructure
- Third-party API and SaaS subscriptions
- Security patches and compliance updates
- Post-launch feature enhancements
- Technical debt accumulation
Many organizations also overlook the cost of cloud management services, including infrastructure monitoring, performance optimization, resource scaling, and security management. While these services increase operational expenditure, they help prevent downtime, improve application performance, and protect long-term ROI.
According to Sctinfo, maintenance can account for 15–20% of original build cost annually.
Technical debt is especially critical. Fixing it later can cost 2–3x more than doing it correctly during initial development. This directly impacts the long-term ROI of web application development by slowing feature delivery and increasing operational cost.
Cost vs Business Impact Comparison in Web Application Development?
Understanding the relationship between web application development cost and business impact is essential for evaluating true web app development ROI. Cost alone does not determine success. Impact determines whether the investment becomes a growth engine or a sunk expense.
The table below breaks down how different cost drivers translate into measurable business outcomes, including ROI of software development, revenue performance, and operational efficiency.
How Each Cost Driver Translates Into Business Outcomes
The table below maps every major cost input to its downstream business impact. Use it to evaluate which investments directly move your ROI needle and which ones become liabilities if mismanaged.
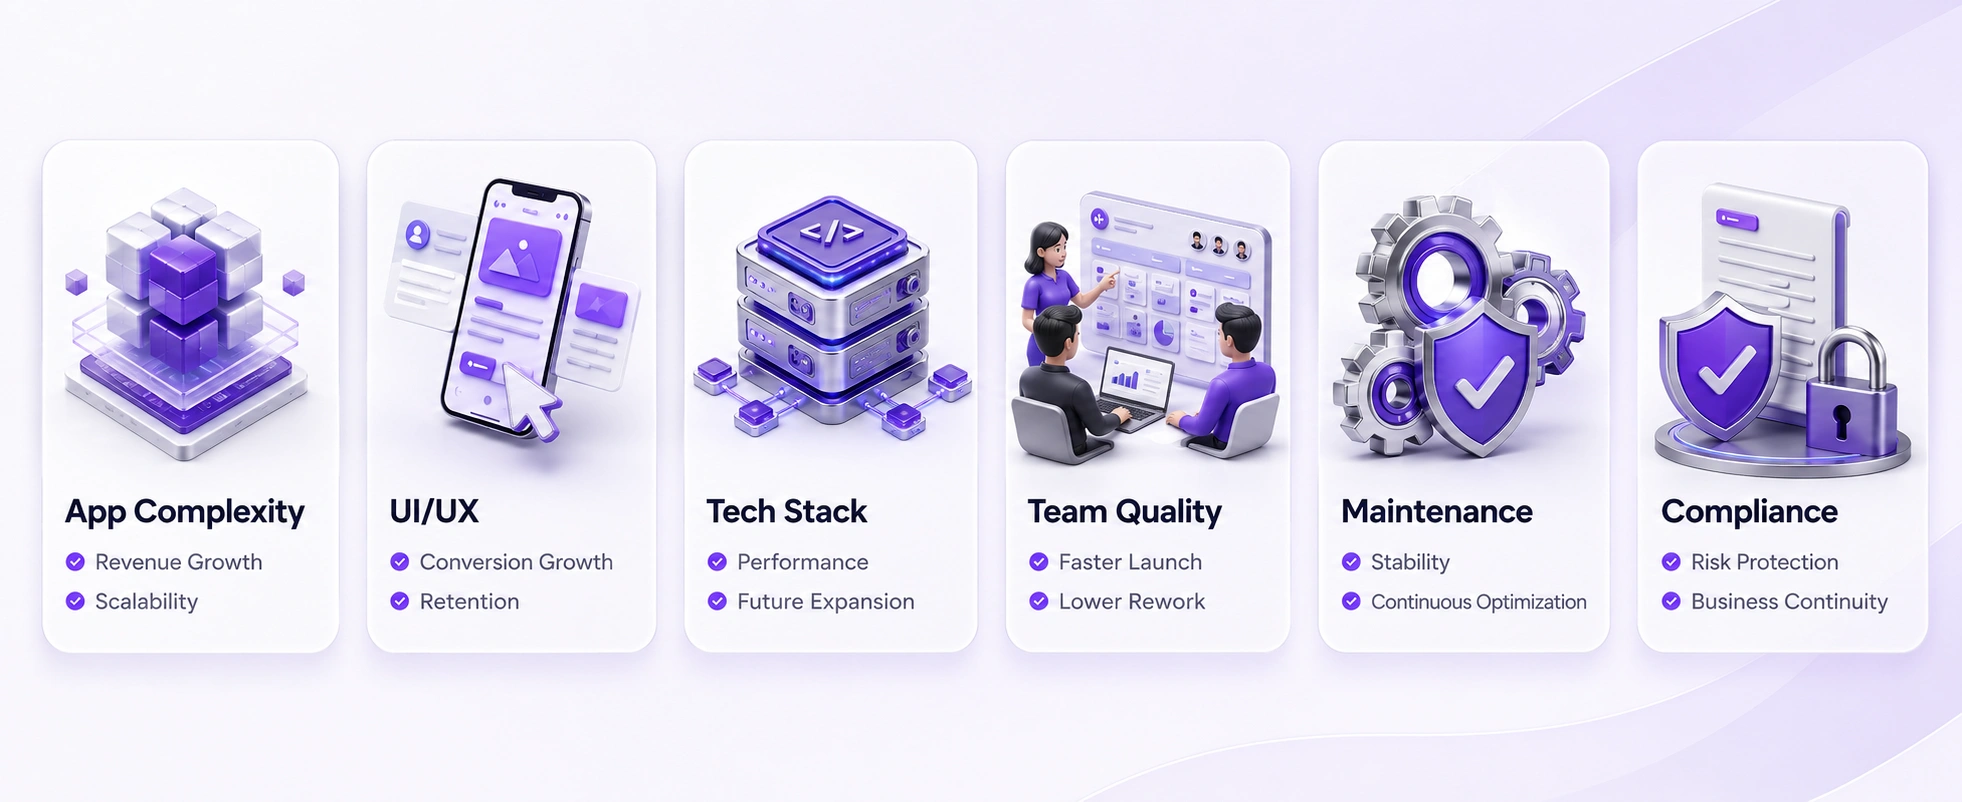
| Cost Factor | Typical Investment Impact | Business Impact (ROI Perspective) | Risk if Mismanaged |
| App Complexity | Increases cost by 30–200% | Enables scalability, automation, and advanced features that drive long-term revenue | Delayed time-to-market and lost revenue window |
| UI/UX Design | Adds 15–50% to build cost | Directly improves conversion rates, engagement, and retention | Low conversion rate and poor user adoption |
| Tech Stack Choice | Influences licensing + infrastructure cost | Determines scalability, performance, and long-term flexibility | High maintenance cost and limited scalability |
| Team Model & Location | 40–60% cost variance globally | Impacts delivery speed, quality, and payback period | Delays that reduce ROI and increase TCO |
| Maintenance & TCO | 15–20% of annual build cost | Ensures system stability, security, and continuous optimization | ROI decay due to technical debt and downtime |
| Compliance & Security | Higher upfront engineering effort | Prevents financial loss, legal risk, and reputational damage | Expensive retrofitting and breach-related losses |
Another often-overlooked factor is dependency on API call services and providers. Modern web applications rely heavily on payment gateways, AI services, communication APIs, analytics tools, and third-party integrations. As usage grows, API-related costs can increase significantly, making vendor selection and usage optimization important components of long-term ROI planning.
How Do You Measure ROI of Web Application Development Before Building?
ROI of web application development is not guesswork. It is a structured financial model combining cost, value creation, and time-based return.
The Core ROI Formula (Simplified for Business Leaders)
ROI Formula (for web app investments):
ROI (%) = ((Total Value Delivered – Total Cost of Ownership) ÷ Total Cost of Ownership) × 100
Payback Period (months) = Total Build Cost ÷ (Annual Value Generated ÷ 12)
Example: Total Investment: $120,000 Annual Revenue Growth: $75,000 Annual Cost Savings: $30,000 Net Value Year 1: $105,000 Year 1 ROI: ~87.5% | Payback Period: ~13.7 months
The Three ROI Buckets Every Business Must Identify
Before evaluating a web application development cost breakdown, businesses must classify ROI type:
- Revenue Generation: Driven by SaaS platforms, e-commerce systems, and subscription models. ROI is measured through conversion rate improvement, customer acquisition, and lifetime value expansion.
- Cost Reduction: Internal automation tools and workflow optimization platforms reduce manual effort, licensing costs, and operational inefficiencies.
- Risk Mitigation: Compliance-heavy systems reduce exposure to financial loss. According to IBM’s 2024 data breach report, average breach costs reach $4.45M, making security-driven ROI highly material.
What “Good ROI” Looks Like in Software Investment
Industry benchmarks from Baytech Consulting suggest:
- 5–10% ROI: acceptable baseline
- 20% ROI: strong performance
- 30–50% ROI: high-performing digital systems
Payback periods typically range between 12–36 months, depending on complexity and adoption speed (Atiba).
A key failure mode is the “Vanity Budget Trap,” where features are built without mapping to measurable ROI buckets.
What Drives Business Impact in Web Application Development ROI?
ROI is not driven by cost alone. It is amplified or reduced by execution decisions that affect revenue timing, scalability, and user experience.
Complexity Is a Revenue Timing Decision
App complexity directly impacts web app development cost for business and time-to-market. According to Intelivita, complexity can increase costs by 30–200%.
Delays create “Market Window Cost,” where late launches reduce cumulative revenue potential. In many cases, a delayed launch costs more than development savings.
UI/UX as a Conversion Engine, Not a Design Expense
UI/UX can increase total development cost by 15–50%, but it directly affects web app conversion rate improvement.
Even a 1% to 2% conversion lift can double revenue output from the same traffic base. This is why UI/UX is a revenue lever, not a design cost center.
According to Forrester research, every $1 invested in UX returns up to $100, an implied ROI of approximately 9,900%. A well-designed UI can lift conversion rates by up to 200%, and comprehensive end-to-end UX work can push conversion improvement to 400%.
Tech Stack Choices Shape Long-Term ROI
Open-source stacks like React and Node.js reduce licensing costs and improve flexibility. However, AI APIs and cloud-native services introduce recurring operational costs.
For example, businesses investing in services often prioritize scalability, component reusability, and faster feature releases, while AngularJS development services are frequently chosen for large-scale enterprise applications requiring structured architecture and long-term maintainability. The right framework choice directly affects development efficiency, future upgrades, and overall ROI.
These decisions directly influence web application ROI by industry, especially in SaaS and enterprise environments where scale multiplies infrastructure expenses.
Team Quality Impacts Payback Period
Low-cost teams often extend delivery timelines, increasing the web app development timeline and cost. According to Software Orca, delayed launches reduce ROI more than upfront savings.
This creates a “False Economy Build” scenario where cheaper execution leads to higher total cost of ownership.
How Does Web App ROI Differ by Business Type?
ROI is not universal. It varies based on business model, user behavior, and monetization strategy.
SaaS Web Applications
According to Gartner, Worldwide IT Spending Forecast, global software spending is projected to grow 14% to $1.23 trillion in 2025, accelerating further to 14.7% in 2026, with GenAI-enhanced software products driving the acceleration.
SaaS platforms generate ROI through subscriptions, retention, and churn reduction. A well-built analytics dashboard can improve retention by up to 15% (DockYard).
Typical payback period: 18–30 months.
High-growth SaaS companies often rely on full stack development services to accelerate product delivery while maintaining consistency across frontend and backend systems. Combined with other services, businesses can reduce development cycles, improve user experience, and launch revenue-generating features faster.
E-Commerce Platforms
E-commerce ROI is driven by conversion rate optimization, checkout efficiency, and uptime reliability. A scalable architecture helped retailers capture millions in additional revenue during peak traffic events (Wildnet Edge).
Typical payback period: 12–18 months.
Many retailers now choose to build Progressive Web Apps (PWAs) to improve mobile performance, increase engagement, and reduce friction in the buying journey. Faster load times, offline functionality, and app-like experiences can significantly improve conversion rates and overall digital ROI.
Internal Enterprise Tools
Internal systems deliver ROI through cost savings and efficiency gains. Mature enterprise platforms often generate 150–400% cumulative ROI over five years.
Typical payback period: 18–36 months.
Customer Service Portals
These platforms reduce ticket volume and support costs while improving customer satisfaction. ROI is measurable through reduced cost per ticket and improved retention.
What Does Web App Development ROI Look Like in Real-World Business Applications?
Real-world applications show how web app development ROI translates into measurable business outcomes such as revenue growth, user engagement, operational efficiency, and market expansion. These examples demonstrate how different industries convert web application development cost into scalable digital assets.
Many of these platforms leverage modern web application features, scalable architectures, and Progressive Web App capabilities to improve user engagement while maximizing long-term business value.
Amazon: E-Commerce Scale and Conversion Optimization ROI
Amazon demonstrates how web application development ROI scales through conversion optimization, system performance, and infrastructure efficiency at massive global scale.
How it generates ROI:
- Revenue model: Transaction-based e-commerce revenue driven by high-frequency purchases and marketplace scaling
- Conversion driver: Continuous optimization of checkout flow, recommendation engines, and product discovery increases conversion rates across millions of users
- Performance ROI: Even milliseconds of improvement in page load time directly reduce cart abandonment and increase completed purchases
- Personalization impact: AI-driven recommendation systems increase average order value by influencing cross-sell and upsell behavior
- Infrastructure scalability: Cloud-native architecture ensures zero downtime during peak events like Prime Day, protecting billions in potential revenue
ROI bucket: Primarily revenue generation through conversion rate optimization and basket size expansion. Secondary benefit is infrastructure scalability, enabling consistent performance under extreme traffic loads.
Key insight: At Amazon’s scale, even a 0.1% improvement in conversion or load speed translates into billions in additional annual revenue, making performance engineering and UX optimization core ROI levers rather than technical enhancements.
Netflix: Personalization-Driven Retention and Subscription ROI
Netflix demonstrates how web application development ROI is driven by retention engineering, personalization systems, and long-term subscriber value rather than one-time transactions.
How it generates ROI:
- Revenue model: Subscription-based recurring revenue driven by monthly and yearly user retention
- Retention driver: AI-powered recommendation systems increase watch time and reduce churn by continuously improving content relevance
- Engagement optimization: Personalized home screens and ranking algorithms directly influence viewing behavior and subscription duration
- Churn reduction impact: Small improvements in engagement metrics significantly extend customer lifetime value (LTV)
- Content efficiency ROI: Data-driven insights reduce content acquisition waste by prioritizing high-performing genres and formats
ROI bucket: Primarily revenue generation through retention and subscription lifetime value. Secondary benefit is cost efficiency in content strategy and acquisition planning.
Key insight: Netflix’s ROI does not depend on individual transactions but on cumulative engagement. Even minor improvements in retention algorithms compound into massive long-term revenue gains due to subscription-based economics.
eGurukul: EdTech Scale and Engagement-Driven Retention ROI
RipenApps developed eGurukul, a large-scale digital learning platform designed for medical entrance exam preparation, built to serve thousands of concurrent learners across geographies.
How it generates ROI:
- Revenue model: Subscription-driven learning with structured exam-focused modules that extend user lifecycle and renewal cycles
- Retention driver: Personalized learning journeys reduce drop-off and increase session depth, two metrics that directly correlate with LTV in EdTech
- Scalability ROI: Cloud-native architecture supports traffic spikes during exam seasons without downtime, protecting revenue during peak demand windows
- Accessibility impact: Geographic reach expansion increases total addressable user base without proportional cost increase
ROI bucket: Primarily revenue generation through subscription retention and lifetime value expansion. Secondary benefit is operational scalability, more users served without linear cost growth.
Key insight: In EdTech, ROI compounds through renewal. A platform that keeps a student engaged through one exam cycle has a high probability of retaining them for the next, making architecture quality a direct driver of subscription revenue.
Cobone: E-Commerce Conversion and Transaction Volume ROI
RipenApps built Cobone, one of the Middle East’s largest daily deals and discounts platforms, designed around high-volume, time-sensitive transaction flows.
How it generates ROI:
- Revenue model: Transaction-based revenue tied directly to deal conversion rates and checkout completion
- Conversion driver: Optimized deal discovery and checkout experience reduce abandonment and increase average transactions per session
- Merchant ROI: Strong repeat user engagement increases merchant acquisition value, creating a two-sided marketplace flywheel
- Uptime as revenue: For a deals platform, downtime during a live offer directly translates to lost transactions, making infrastructure reliability a revenue metric, not just a technical one
ROI bucket: Primarily conversion rate improvement and transaction volume growth. Secondary benefit is merchant retention through demonstrated deal performance.
Key insight: On a deals platform, every percentage point of checkout completion improvement multiplies across thousands of daily transactions. This is where UI/UX investment stops being a design cost and becomes a direct revenue driver, exactly the dynamic described in the cost vs. business impact table above.
What Are the Hidden Costs That Reduce Web App ROI?
Even strong builds lose ROI due to overlooked costs and long-term inefficiencies.
Technical Debt and Productivity Loss
Technical shortcuts create long-term drag on development velocity. Teams often spend 23% of time managing technical debt, reducing feature output and delaying ROI realization.
This creates an ROI leak where revenue is delayed, not lost.
Maintenance and Operational Decay
Post-launch maintenance is not optional. Annual costs typically range between 15–20% of build cost, including updates, monitoring, and security patches.
This forms the “Living Infrastructure Cost” of digital products.
Compliance Cost Creep
In regulated industries, compliance requirements add ongoing engineering overhead. Retrofitting compliance later is significantly more expensive than building it from day one.
The examples above demonstrate why web app development is critical for business growth. Whether the objective is revenue generation, operational efficiency, customer retention, or market expansion, the quality of execution directly influences long-term ROI.
Final Thoughts
Web application development cost is only meaningful when measured against business outcomes. ROI is determined by how well the system generates revenue, reduces operational friction, or mitigates risk over time. Businesses that succeed treat web apps as long-term assets, not one-time projects. They plan for Living Infrastructure Cost from the outset, budgeting 15–20% of build cost annually for maintenance, security, and optimization, rather than discovering it after launch.
They avoid the Vanity Budget Trap by mapping every feature to a measurable ROI bucket before a single line of code is written. And they eliminate False Economy Builds by evaluating vendor quality alongside vendor cost, understanding that a delayed launch costs more in lost revenue than a premium development partner ever would. Choosing the right development agency is not just a technology decision. It is a business investment decision that influences scalability, time-to-market, maintenance costs, and long-term returns. Organizations that combine strategic development with reliable react js development services are often better positioned to maximize ROI while maintaining operational efficiency as they grow. To turn planning into execution, RipenApps helps organizations align web app development cost with measurable digital transformation ROI, ensuring every build is designed for scalability, efficiency, and long-term business impact.
FAQs
Q1: What is a realistic ROI for web app development?
A realistic ROI for web app development typically ranges from 5–10% at baseline. Strong-performing digital products reach 20%, and high-impact builds, particularly SaaS platforms and e-commerce systems, can deliver 30–50% ROI depending on execution quality, adoption speed, and scalability of the solution.
Q2: How long does it take to see ROI from a web app?
Most businesses reach payback within 12–36 months. E-commerce platforms tend to recover investment fastest at 12–18 months due to direct transaction revenue. SaaS platforms typically take 18–30 months. Enterprise internal tools run 18–36 months but generate stronger cumulative returns over a five-year window. The exact timeline depends on how quickly the application generates measurable revenue or operational savings.
Q3: What is the formula for calculating web app ROI?
Use two formulas together:
ROI (%) = ((Total Value Delivered – Total Cost of Ownership) ÷ Total Cost of Ownership) × 100
Payback Period (months) = Total Build Cost ÷ (Annual Value Generated ÷ 12)
Apply the ROI formula to measure whether the investment creates value. Apply the payback period formula to understand when it starts returning cash. Both together form a complete business case.
Q4: What hidden costs reduce web app ROI?
The five most common ROI reducers are: technical debt accumulation (teams spend roughly 23% of development time managing it), annual maintenance costs (typically 15–20% of the original build cost), third-party API pricing changes, compliance retrofitting in regulated industries, and delayed launches from underscoped or underresourced development teams. Planning for these from Day 1, rather than treating them as future problems, is what separates high-ROI builds from expensive ones.
Q5: Should businesses build custom or use off-the-shelf solutions?
Custom web applications deliver higher long-term ROI for businesses with specific workflows, scale requirements, or competitive differentiation needs. Off-the-shelf tools lower initial cost but introduce ROI ceilings through limited customization, recurring licensing fees, and dependency on vendor roadmaps. The break-even point between custom and off-the-shelf typically falls between Year 2 and Year 3, after which custom builds generate compounding returns.
Q6: How does team location affect ROI?
Team location can reduce upfront development cost by 40–60%, which improves the ROI ratio when quality and delivery timelines are preserved. However, a lower-cost team that delivers six months late often costs more in total than a higher-rate team that ships on schedule, because delayed launches mean delayed revenue, missed market windows, and frustrated early users. Cost is a lever, not a guarantee. Beyond location, expertise with the best tech stack for web app development often has a greater impact on ROI than hourly rates alone.

SHARE
WRITTEN BY
Ishan Gupta
CEO & Founder
Ishan Gupta is a seasoned entrepreneur and CEO with extensive 8+ years of experience in business and mobile app development landscape. He believes that the right digital product allows companies to focus on what they do best, while technology handles the rest. With deep exposure to global markets, he understands what makes an app succeed. His approach translates business needs into clear product strategies, ensuring that every feature contributes to measurable ROI.
View All Articles


 India
India USA
USA Australia
 Canada
 UK
UK UAE
UAE