


Key Takeaways
- $391.3 billion – Projected global mobile app market value in 2026.
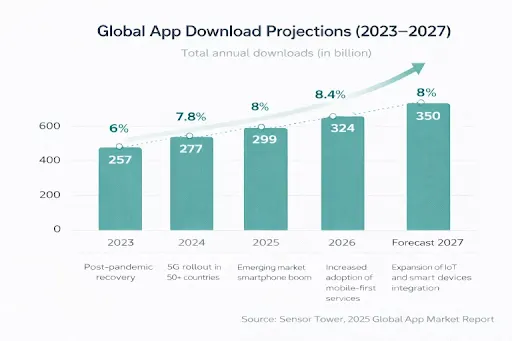
- 324 billion – Expected annual app downloads globally in 2026.
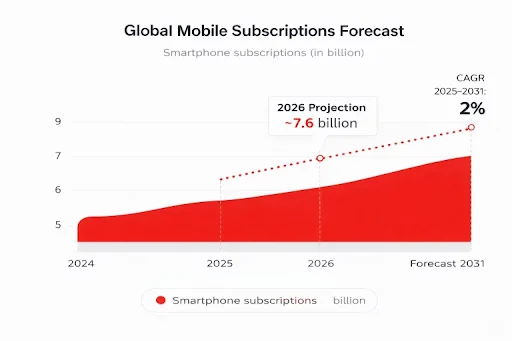
- 7.5 billion – Projected global active smartphone subscriptions by the end of 2026.
- 5.5 trillion+ hours – Expected annual time spent inside mobile applications.
- 4.2 hours/day – Average daily time spent using mobile applications globally.
- 7.5 billion – Projected generative AI app downloads in 2026.
- 70.36% – Android’s reported worldwide mobile OS share in early 2026.
- 65%+ – Reported share of global app revenue generated by iOS.
- 25.3%–30% – Typical day-one app retention range cited by Stream.
- $233 billion – Projected 2026 consumer spending across the App Store and Google Play.
The mobile app industry has moved far beyond simply counting downloads. In 2026, the bigger story is how deeply apps are embedded in everyday life, how much users spend inside them, and how effectively businesses can convert downloads into long-term engagement and revenue.
The global mobile app market is projected to reach $391.3 billion in 2026, according to Mordor Intelligence. At the same time, users are spending trillions of hours inside mobile applications, while app downloads continue to grow across emerging and established markets.
For founders, product managers, marketers, and business leaders, these mobile app statistics provide more than market context. They help answer practical questions: Is the market still growing? Which regions offer the strongest opportunity? Which categories are generating usage and revenue? How important are retention and monetization? And what should businesses prioritise when building a mobile product?
Choosing the right mobile application development company can also play an important role in turning these market opportunities into scalable, user-focused mobile products.
Table of Contents
Global Mobile App Market Overview: Where the Industry Stands
The global mobile application market continues to expand in 2026, but the nature of that growth is changing. According to Mordor Intelligence, the mobile app market is projected to reach $391.3 billion in 2026. Precedence Research places the global mobile application market at $330.61 billion in 2025, with a long-term trajectory toward more than $1.2 trillion by 2035.
These figures demonstrate the scale of the opportunity, but market size alone does not explain the current state of the industry. Mobile has become the primary interface through which consumers access entertainment, communication, commerce, financial services, health tools, and increasingly generative AI. As a result, businesses are competing not simply to acquire users but to become part of their everyday routines.
This is why current mobile application statistics increasingly point toward three connected priorities:
- User acquisition
- Long-term retention
- Monetization
The download itself is no longer the final measure of success. An application that attracts millions of installs but loses users shortly after installation can generate substantially less business value than a smaller product with stronger retention and recurring revenue.
The broader market picture also shows why businesses need to evaluate mobile opportunities beyond installation volume. High download numbers can indicate strong market demand, but they do not necessarily reveal whether users continue engaging with an application or whether that engagement translates into revenue. Looking at downloads alongside usage, retention, and monetization provides a more complete picture of the market.
The growth of the mobile ecosystem is also creating opportunities across different industries. Entertainment and social applications continue to compete heavily for users’ attention, while ecommerce, fintech, healthcare, and other categories are using mobile applications to make digital services more accessible and convenient. This means the opportunity is not limited to a single type of business or application.
For businesses considering a mobile product, the key question is therefore not simply whether the mobile market is growing. It is whether the product can identify a meaningful user need, create a reason for repeated engagement, and establish a sustainable path to monetization. The statistics that follow provide the market, usage, platform, category, retention, and revenue context needed to evaluate that opportunity.
Mobile App Revenue: The Rise of the “Retention Economy”
According to Precedence Research, mobile app revenue reached $330.61 billion in 2025, and broader forecasts from Statista (which include the massive in-app advertising sector) suggest a total revenue closer to $633 billion by the end of 2026 and is projected to reach 781 billion in 2029. We are seeing a move away from one-time paid downloads; in-app purchases (IAP), and subscriptions now command over 94% of total market value.
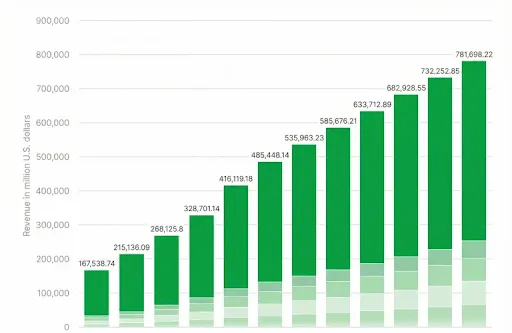
In-app purchases and subscriptions have become central to this model. Instead of relying only on the initial download, businesses can generate revenue through recurring subscriptions, premium functionality, digital goods, advertising, and other post-install experiences. This creates what can be described as a retention economy.
The value of an application increasingly depends on how long users remain active, how frequently they return, and how much value they generate throughout the customer lifecycle. For businesses, this also makes product quality more important. Performance, onboarding, personalization, security, and user experience directly affect the ability of an application to turn initial acquisition into sustainable revenue.
Smartphone User Subscriptions: Near-Universal Connectivity
Global smartphone connectivity continues to create the foundation for mobile application growth.
Ericsson projects that global active smartphone subscriptions will reach approximately 7.5 billion by the end of 2026. The same Ericsson data cited in the existing article projects approximately 2.9 billion 5G subscriptions by the end of 2026.
This level of connectivity expands the addressable market for mobile applications across both developed and emerging economies. Smartphones are no longer limited to communication. They increasingly function as payment devices, entertainment systems, health-management tools, work platforms, shopping channels, and gateways to digital services.
For product teams, this means mobile applications need to account for different network environments, devices, screen sizes, operating systems, and usage contexts. Connectivity also creates opportunities for richer application experiences. Faster networks can support more media-heavy experiences, real-time functionality, connected services, and increasingly sophisticated AI-powered features.
Mobile App Downloads: Quality Over Quantity
Global app downloads are expected to exceed 324 billion in 2026, while the existing industry data indicates an 8.4% CAGR since 2023. However, download growth does not automatically translate into application success.
Users have more choices than ever before, while app stores contain millions of applications. This makes discovery difficult and increases the importance of differentiation, reviews, performance, onboarding, and retention.
India remains one of the world’s largest download markets, with more than 25 billion annual installs cited in the current research, followed by markets including the United States and Brazil. (Source: Sensor Tower)
The broader mobile app growth statistics therefore point to a market where acquisition remains important, but post-install engagement is becoming equally critical.
Most Downloaded and Popular Apps in 2026
Download rankings provide useful insight into the types of applications that continue to attract global attention. The current worldwide list includes:
- ChatGPT
- TikTok
- Temu
- Snapchat
These applications represent several of the strongest mobile categories: communication, social networking, entertainment, commerce, and generative AI.
However, global rankings do not tell the entire story. App preferences differ considerably by geography, reflecting local consumer behaviour, payment ecosystems, digital maturity, and category adoption.
Top Downloaded Apps in 2026 (Worldwide)
The leading global download group includes ChatGPT, TikTok, Instagram, Facebook, WhatsApp, Temu, and Snapchat. The list demonstrates the continued strength of social and communication applications alongside the rapid rise of generative AI. (Source: Business of Apps)
For businesses, the takeaway is not to replicate these applications but to understand why these categories generate repeated engagement. Applications that solve recurring problems, provide frequent entertainment, facilitate communication, or deliver continuously changing content have a natural advantage in creating habitual usage.
Most Downloaded Apps in the USA
The United States shows strong demand across entertainment, communication, social media, and financial applications.
The leading group includes:
- TikTok
- YouTube
- Cash App
- Snapchat
This combination illustrates the importance of both engagement and utility. Social applications compete for attention, while financial applications become part of recurring everyday behaviour.
Most Downloaded Apps in India
India remains one of the world’s largest mobile download markets.
Leading applications include:
- Flipkart
- YouTube
- Meesho
- PhonePe
- Telegram
The list highlights the importance of messaging, social media, commerce, video, and digital payments within India’s mobile ecosystem.
Most Downloaded Apps in Europe
European downloads continue to be led by communication, social media, and entertainment applications.
Leading applications include:
- TikTok
- Telegram
- Spotify
- Snapchat
Most Downloaded Apps in Southeast Asia
Popular applications across Southeast Asia include:
- TikTok
- Shopee
- Telegram
- YouTube
The regional mix highlights the combination of social engagement, entertainment, communication, and mobile commerce.
Most Downloaded Apps in Latin America
Latin America’s leading download categories continue to include messaging, social media, entertainment, and fintech.
Top applications include:
- TikTok
- Mercado Libre
- Telegram
- YouTube
Most Downloaded Apps in the Middle East
The leading applications in the Middle East include:
- TikTok
- Snapchat
- Telegram
- YouTube
Regional download rankings demonstrate why businesses should avoid treating the global mobile market as one uniform audience. Product-market fit, localization, monetization, and platform strategy can vary significantly between regions.
Mobile App Statistics by Country
Global mobile app statistics become more useful when they are viewed through the lens of individual markets.
Countries differ in download volume, consumer spending, smartphone penetration, operating-system preferences, and application category adoption.
Annual App Downloads by Country
| Country | Annual App Downloads |
| India | 25+ billion |
| United States | 12+ billion |
| Brazil | 10+ billion |
| Indonesia | 9+ billion |
| Mexico | 8+ billion |
India remains the largest download market among the countries shown, while the United States continues to represent a particularly important high-value consumer market.
This difference between volume and value is important for businesses.
A market with a very large number of downloads may provide enormous acquisition potential but lower average consumer spending. Another market may generate fewer downloads while producing significantly higher revenue per user.
Total Mobile App Revenue by Country
High-income markets continue to dominate mobile app spending. The leading markets cited in the current data are:
- United States
- China
- Japan
- South Korea
- United Kingdom
- Germany
The comparison between download and revenue rankings reinforces an important principle in mobile app revenue statistics: the largest audience is not necessarily the most valuable audience.
Businesses therefore need to evaluate both acquisition potential and monetization potential before prioritising a market.
The United States is particularly important because it combines a mature smartphone market with strong consumer spending across mobile applications. China, Japan, South Korea, the United Kingdom, and Germany also represent significant revenue markets, showing that mobile monetization is concentrated across markets where consumers have established digital purchasing behaviours.
This creates an important distinction between market size and market value. A country can generate a very large number of downloads because of its population and high smartphone adoption, while another market can generate greater revenue from a comparatively smaller user base. Download volume therefore provides only one part of the picture when businesses assess where to launch or expand an application.
For founders and product teams, country-level revenue data can help shape decisions around localization, platform priorities, pricing, subscription strategies, and market-entry sequencing. A product targeting a high-spending market may require a different monetization approach from one designed primarily to maximise reach in a high-download market.
The difference also reinforces the importance of understanding the target audience before development begins. Businesses should consider not only how many potential users exist in a market, but also how they behave, what categories they use most, their willingness to spend, and which platform they prefer.
Looking at revenue alongside downloads can therefore provide a more defensible picture of commercial opportunity. Markets with high download volumes can support user acquisition and scale, while markets with stronger consumer spending can provide greater monetization potential.
For businesses evaluating international expansion, these mobile app statistics suggest that market selection should be based on a combination of audience size, engagement, platform distribution, and revenue potential rather than download volume alone.
Users’ Time Spent: A Multi-Trillion-Hour Engagement
One of the strongest indicators of mobile’s importance is the amount of time people spend inside applications. Sensor Tower data cited in the existing research indicates that users spent more than 5.3 trillion hours inside mobile apps globally in 2025, with that figure expected to exceed 5.5 trillion hours in 2026.
The average global user spends approximately 4.2 hours per day using mobile applications.
This scale of engagement explains why mobile applications have become strategically important across industries.
Users’ Time Spent in the U.S.
The existing research cites an average of approximately 5 hours and 16 minutes of daily smartphone usage in the United States. (Source: Exploding Topics Report)
This level of engagement gives businesses a significant opportunity to integrate mobile experiences into everyday routines.
Users’ Time Spent in India
India also demonstrates strong mobile engagement, with users spending approximately 4.9 to 5.3 hours per day on smartphones according to the current research.
With a large smartphone population and high app-install volume, India represents a major market for businesses seeking mobile-first growth.
The important insight is that mobile applications are not competing only for downloads. They are competing for time.
Every additional minute spent within an application can strengthen engagement, create monetization opportunities, and increase the probability that the application becomes part of a user’s routine. (Source: Business of Apps)
Mobile App Usage Statistics: Frequency & Session Patterns
Time spent measures the overall depth of mobile engagement, but it does not explain how frequently users return to applications. This distinction is important for understanding mobile app usage statistics.
The existing 2026 research indicates that 51% of users interact with their favourite applications more than 11 times per day. That behaviour demonstrates the importance of micro-moment engagement: users may not spend a long uninterrupted period inside every application, but they can return repeatedly throughout the day.
Frequent usage can occur across several application categories. Messaging applications may be opened repeatedly to check converzations. Social platforms can generate multiple short sessions as users check feeds and notifications. Finance applications can be opened around transactions, balances, or payments. Utility applications may be accessed only when a specific need arises.
Therefore, a successful mobile experience does not necessarily need to maximise session length. It needs to make each session useful. For product teams, this changes how mobile app usage statistics should be interpreted.
Key usage signals include:
- Frequency of app opens
- Session patterns
- Repeat visits
- Time spent per session
- Actions completed per session
- Notification-driven visits
- Returning-user behaviour
The goal should be to create meaningful reasons for users to return rather than artificially increasing session frequency. This is particularly important in 2026 because app fatigue is increasing. Users have access to millions of applications but limited attention. Applications that deliver immediate value have a stronger chance of becoming part of a user’s regular routine.
For businesses, frequency should therefore be evaluated alongside retention and conversion. High usage with low retention may indicate temporary interest, while consistent repeat usage over time can indicate stronger product-market fit.
Mobile Application Market Size: The Trillion-Dollar Horizon
Long-term projections show how far the mobile application market could expand. Precedence Research estimates that the global mobile application market was valued at $330.61 billion in 2025 and could reach approximately $1.23 trillion by 2035, representing a projected CAGR of 14.04%.
Gaming remains one of the largest revenue categories, while health and fitness and fintech continue to represent important growth opportunities. The long-term market trajectory is significant for businesses considering new mobile products because it demonstrates that mobile applications are not a temporary digital channel. They are becoming a core part of how consumers interact with businesses.
Business Impact of These Stats
The numbers point toward several practical conclusions. First, businesses should evaluate mobile as a long-term product channel rather than a standalone marketing initiative.
Second, acquisition should not be treated as the final goal. Retention, engagement, and monetization need to be considered from the earliest stages of product planning.
Third, regional differences matter. India and other high-volume markets can provide significant acquisition opportunities, while high-income markets can offer stronger consumer spending.
Finally, the growing size of the market increases competition. A business entering the mobile space needs a clear product proposition, strong user experience, scalable architecture, and an ideal monetization strategy aligned with its target audience.
If you are evaluating the opportunity for a new application, this is the point where market research should translate into product planning. Businesses can explore mobile app development services to turn the market opportunity into a scalable product strategy.
Generative AI on Mobile: The 2026 Force Multiplier
Generative AI has become one of the strongest forces shaping mobile applications in 2026. Rather than operating as a separate technology category, generative AI is increasingly becoming part of everyday mobile experiences.
Gen AI App Downloads
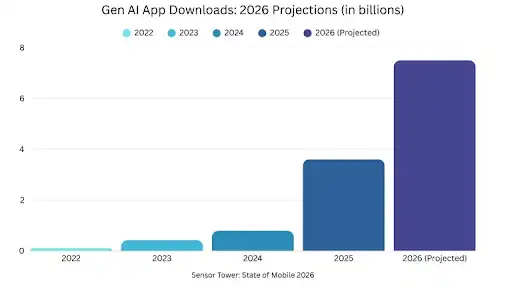
Generative AI applications experienced extraordinary growth between 2022 and 2025. The current research indicates that downloads increased from approximately 100 million in 2022 to 3.6 billion in 2025. Based on the existing growth trajectory, downloads could reach approximately 7.5 billion in 2026, representing roughly 108% year-over-year growth.
This makes generative AI one of the strongest contributors to current mobile app growth statistics.
The growth also demonstrates that users are increasingly comfortable accessing AI capabilities through mobile interfaces.
Gen AI App Category Breakdown
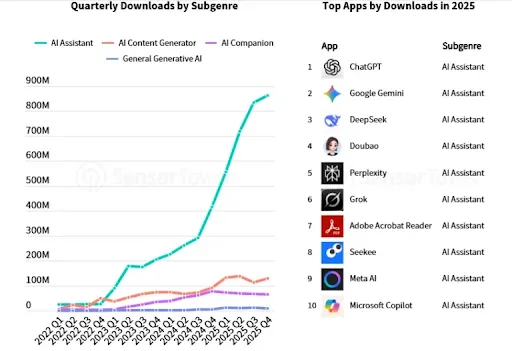
AI assistants currently dominate the generative AI application category. The leading names include:
- ChatGPT
- Gemini
- DeepSeek
The category demonstrates that users are looking for AI applications that provide immediate utility rather than requiring complex technical knowledge. At the same time, specialised AI categories continue to create opportunities for new products.
The Shift to Mobile: Gen AI’s Primary Growth Driver
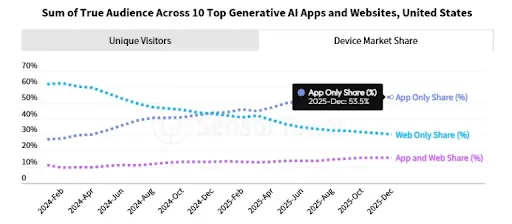
The relationship between generative AI and mobile is becoming increasingly important. The existing research indicates that mobile-only generative AI usage in the United States increased substantially between 2024 and December 2025, while web-only usage declined.
This shift demonstrates that users increasingly expect AI to be available wherever they are, rather than only through desktop environments. Mobile also provides AI with access to contextual features such as cameras, microphones, location, notifications, and other device capabilities.
The Image Generation Spike: Strong Launches, Weak Retention
Image generation created significant download spikes for leading generative AI applications. The existing research cites weekly download peaks of approximately 26 million for ChatGPT and 25 million for Google Gemini following major image-generation releases.
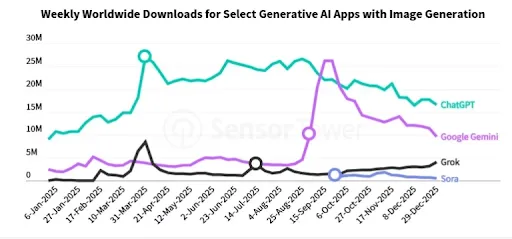
However, spikes in downloads do not guarantee long-term retention. This illustrates a broader lesson for mobile businesses: a new feature can create acquisition, but sustained value determines whether users remain active.
Gen AI Market Leaders
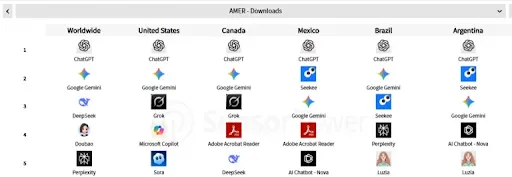
AI assistants currently occupy the strongest position within the generative AI mobile category. The concentration around major AI assistants demonstrates both the opportunity and the competitive challenge. New products need to provide a clear reason for users to switch, adopt, or continue using them.
Business Impact of These Stats
The projected 7.5 billion generative AI app downloads demonstrate that AI is moving toward mainstream mobile usage. For businesses, the opportunity is not simply to add an AI feature.
The stronger opportunity is to determine where AI can improve the existing product experience through personalization, recommendations, content generation, automation, search, support, or workflow assistance. Mobile-first AI products also need to prioritise speed, usability, privacy, and retention rather than relying solely on novelty.
iOS vs Android: Various Platform Dynamics
The iOS-versus-Android discussion has become more nuanced. Android continues to dominate global device reach, while iOS continues to demonstrate strong consumer spending and ecosystem loyalty. For businesses, platform selection should therefore depend on target geography, audience, monetization model, and product requirements.
Mobile OS Market Share
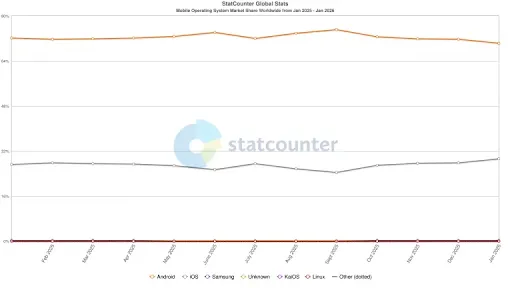
The current research reports Android at approximately 70.36% global market share in early 2026. Android’s strength is particularly pronounced in emerging markets, including India and China. At the same time, iOS has a stronger position in several high-income markets. In the United States, the existing research reports iOS at approximately 59.77% share.
These differences matter when interpreting mobile app development statistics because platform distribution directly affects potential reach.
Total Apps Available: Quality Purge vs. Quantity Growth
The current app-store ecosystem contains millions of applications. The existing research cites approximately:
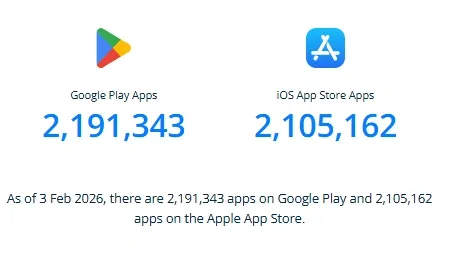
- 2.19 million apps on Google Play
- 2.10 million apps on the Apple App Store
The large number of applications demonstrates the opportunity available to developers but also highlights the competition for visibility.
More applications do not automatically mean greater opportunity.
The challenge is increasingly to build products that provide enough value to be discovered, downloaded, retained, and recommended.
Revenue Generated: The Spending Gap Widens
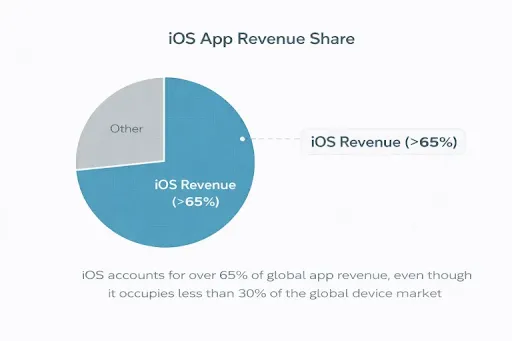
iOS continues to demonstrate stronger consumer spending despite Android’s larger global user base. The existing research reports that iOS accounts for more than 65% of global app revenue, despite representing less than 30% of the global device market in the cited comparison.
It also reports average spending of approximately $1.64 per iPhone user per app, compared with $0.43 for Android users. This is a critical consideration when evaluating mobile app revenue statistics.
A business focused on premium subscriptions or high-value in-app purchases may prioritise iOS in selected markets, while a business focused on broad distribution or advertising may benefit from Android’s larger reach.
User Loyalty & Switching Habits: The Retention Moat
Platform loyalty also influences long-term application strategy. The existing research cites approximately 90% loyalty among iPhone users when upgrading, while Android loyalty is reported at approximately 70%–80%. (Source)
These figures should be interpreted as directional indicators rather than universal behaviour across every market. The broader lesson is that platform ecosystems can influence Android vs iOS user behaviour and therefore affect product strategy.
Business Impact of These Stats
These dynamics prove that a one-size-fits-all strategy is obsolete. Brands targeting North America or premium segments must leverage custom iOS app development to meet high UX expectations and capture high-spend users. Conversely, for products where scale or ad revenue is key, an Android-first strategy in APAC is the logical choice.
Wondering how? Looking at the previous stats, you will notice one major thing: choose the platform strategy that completely resonates with the type of monetization model you need and your target audience. To sum this up, you should now adopt a cross-platform app development approach that helps you target both operating systems’ users.
If you want to have a faster market entry and consistent performance across devices, you should have a well-defined app development strategy and expert guidance. To achieve this, you can leverage top cross platform app development services.
Category-wise App Performance: Where Usage and Revenue Come From
Mobile application performance differs considerably by category. Gaming, social media, ecommerce, fintech, and health and wellness applications each have different usage patterns, monetization models, and retention challenges. Understanding these differences is essential when interpreting mobile app growth statistics.
Gaming Apps: The Undisputed Revenue Engine
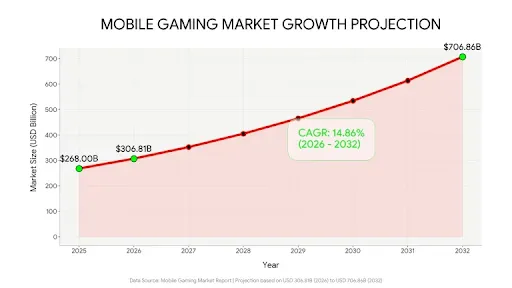
Mobile gaming remains one of the strongest revenue categories in the app ecosystem. The existing research cites a global mobile gaming market value of approximately $306.81 billion in 2026, based on Research and Markets. Gaming also demonstrates the importance of lifetime value.
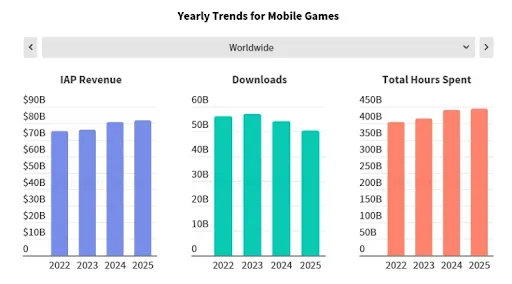
2025 was another year of revenue growth across the App Store and Google Play. Time spent rose slightly even as downloads fell, pointing to a market shifting from new-user volume to lifetime value expansion. Projections for 2026 indicate continued growth, particularly in the gaming sector, driven by the major adoption of esports and gaming tournaments. (Source: Sensor Tower, State of Mobile 2026)
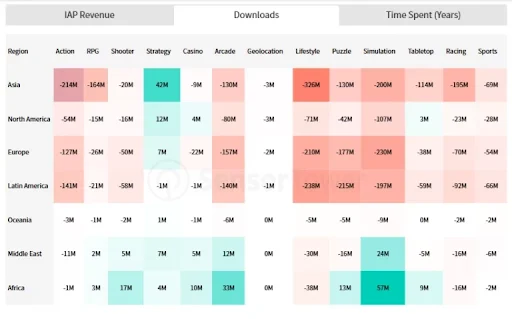
Platform Split: While Android commands over 71% of the download volume, iOS generates over 61% of the global gaming revenue, highlighting the high-value nature of the Apple ecosystem.
Gaming Apps Performance by Genre and Region
Strategy games generated strong revenue gains across major regions. The existing research highlights titles such as Last War: Survival and Whiteout Survival within the strategy category, while puzzle games performed strongly in Europe and shooter games expanded in Asia.
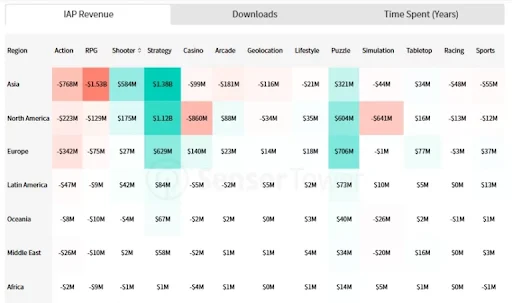
The important lesson is that gaming performance varies by both genre and geography. A gaming product should therefore evaluate local preferences rather than assuming that one global content strategy will work everywhere.
Social Media Apps: The Battle for Screen Share
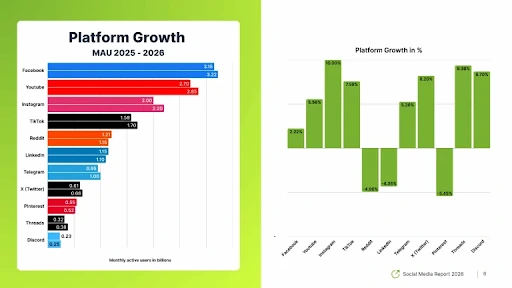
Social media applications continue to dominate mobile attention. The existing research cites approximately 3.22 billion monthly active users for Facebook and 2.85 billion for YouTube in early 2026. Social applications are increasingly becoming discovery environments as well as communication platforms.
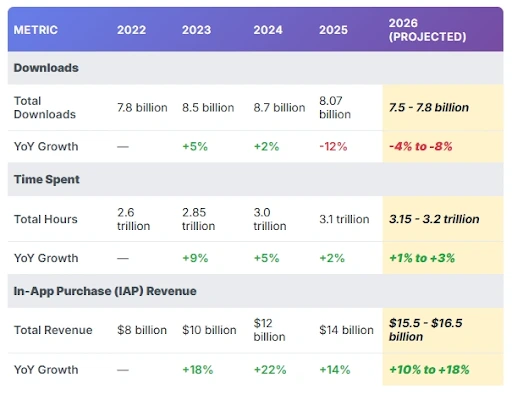
Downloads, Time Spent, and IAP Revenue
Total time spent in social media apps edged up only slightly in 2025, rising from 3.3 trillion hours in 2024 to 3.4 trillion hours. Despite slow growth, more than 60% of total time spent across mobile apps occurred within Social Media and Social Messaging apps. Social media also ranked as the top genre by IAP revenue in 2025, growing 16% to $15 billion. TikTok, YouTube, and Snapchat led the category with distinct monetization strategies. (Source)
The average user now engages with 7 to 8 different platforms each month, spending roughly 2 hours and 23 minutes daily across them.
eCommerce Apps: The Social-Commerce Convergence
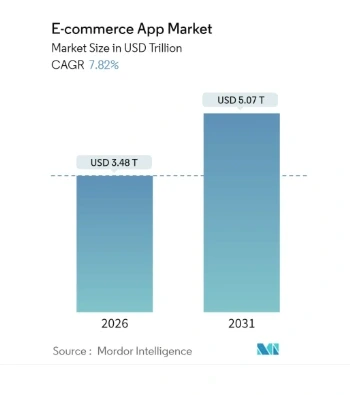
Mobile commerce continues to reshape digital retail. The current research cites a global ecommerce market value of approximately $3.48 trillion, with projected revenue reaching $3.89 trillion in 2026. (Mordor Intelligence)
Mobile commerce penetration is also significant across several markets. The cited figures include:
- UK: 30.6%
- US: 15.8%
- China: approximately 47% of retail sales through mobile
Social commerce is further connecting discovery and purchasing, particularly through platforms such as TikTok and Instagram.
For ecommerce businesses, this means mobile applications need to reduce friction between product discovery, evaluation, and purchase.
Fintech Apps: Embedding Finance into Everyday Life
Fintech continues to become part of routine mobile behaviour. The current research projects fintech app downloads to exceed 8.5 billion by the end of 2026, with approximately 5% year-over-year growth. Digital wallets and peer-to-peer payment applications are particularly strong within the category.
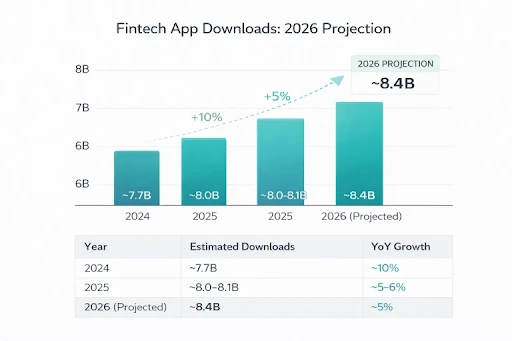
The rise of mobile fintech demonstrates that applications can become infrastructure for everyday activities rather than occasional digital tools.
Health and Wellness Apps: The Digital Personal Trainer
Health and wellness applications are increasingly moving toward personalised digital experiences. The global fitness app market is expected to reach approximately $12.1 billion in 2026, according to the source cited in the existing research. (P&S Intelligence)
The current data also indicates strong adoption of wearable-device integration and continued growth in activity tracking. Health and wellness applications reached approximately 3.96 billion downloads in 2025, with downloads expected to exceed 4 billion in 2026 based on the current growth trajectory.
RipenApps has also worked on health and wellness products, including emmyHealth, but the refresh should use only approved and documented portfolio proof when adding specific performance figures.
Business Impact of These Stats
Category matters because each application type creates different expectations around engagement and monetization.
Gaming may depend heavily on lifetime value and in-app purchases. Fintech depends on trust and recurring utility. Ecommerce depends on conversion and repeat purchasing. Health applications depend on continued engagement and personalised experiences.
Businesses should therefore select product architecture, UX, monetization, and retention strategies according to category-specific behaviour.
User Retention & App Lifecycle: Why Apps Fail to Keep Users Engaged
Downloads create opportunity, but retention determines whether that opportunity becomes sustainable business value. The existing research cites approximately 370–380 million app uninstallations per day worldwide, highlighting the scale of the retention challenge.
Average Retention vs Average Churn (Month-Wise)
Mobile applications typically experience their steepest user losses shortly after installation. Stream data cited in the existing research places day-one retention at approximately 25.3%–30%.
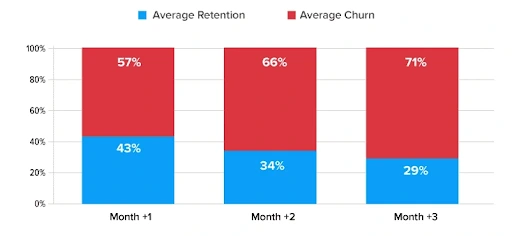
The data clearly shows how quickly user engagement drops as apps move through their lifecycle. On average, only 43% of users are retained after the first month, while 57% churn during the same period. Retention continues to decline in the following months, falling to 34% by Month 2 and further down to just 29% by Month 3, with churn rising to 71%.
So, how many users are actually still using an app after the first 30 days of installation?
A category-wise breakdown reveals that Day-30 retention rates on Android apps remain below 10% for most categories. This data is as of quarter 3 in 2024. News and magazine apps are leading with around 9.9% retention, followed by business apps (5.1%), transportation (4.4%), shopping (4%), health and fitness (3.4%), & finance (3.1%). Furthermore, categories such as travel, entertainment, and utility perform even lower.
The current retention figures also show approximately:
| Lifecycle | Retention | Churn |
| Day 1 | 25.3%–30% | 70%–74.7% |
| Month 1 | 43% | 57% |
| Month 2 | 34% | 66% |
| Month 3 | 29% | 71% |
The numbers show why acquisition alone cannot determine application success.
If a large proportion of acquired users leave quickly, customer acquisition costs become increasingly difficult to recover.
Retention Rate by App Type
Retention also varies considerably by category. The existing Q3 2024 Android data cited in the current article reports the following Day-30 retention benchmarks:
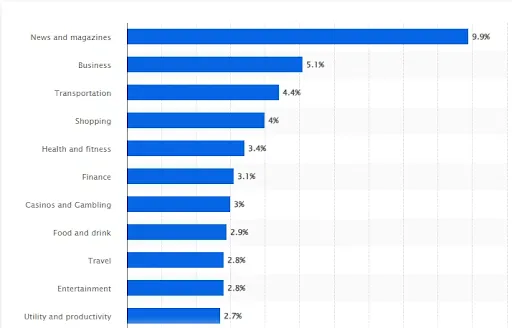
The figures demonstrate why retention benchmarks should always be interpreted within category context.
A finance application, for example, may not need the same usage frequency as a social application to provide meaningful business value.
Likewise, a shopping application may depend more heavily on periodic purchase behaviour than daily engagement.
The Psychology of Deletion: Why Users Leave in 2026
By the end of 2026, user patience is expected to hit an all-time low. According to Panto AI, over 20% of users abandon an app after just one opening. The primary causes are confusing onboarding, excessive permission requests, or mandatory sign-ups before seeing value.
While push notifications can increase retention by 3-10x, sending more than 3-6 notifications a week causes 40% of users to disable them or delete the app entirely (Business of Apps). Push notifications can support retention when used appropriately, but overuse can produce the opposite result.
The current research cites that sending more than three to six notifications per week can cause a significant number of users to disable notifications or delete an application.
The core principle is simple: reduce time to value. Users should understand what an application does, why it is useful, and how to achieve its primary benefit as quickly as possible.
Business impact of these stats
Retention should be treated as a product metric rather than only a marketing metric. A strong acquisition campaign can bring users into the product, but onboarding, UX, performance, personalization, and product value determine whether they stay. Businesses should therefore measure retention from the earliest product iterations and continuously identify where users are leaving.
Mobile App Monetization Models & Revenue Insights
The strategy for generating revenue has shifted from transactional to relational. As user acquisition costs continue to climb, top-grassing apps are moving away from single-value streams in favor of sophisticated, AI-optimized hybrid models. According to Sensor Tower, global consumer spending on the App Store and Google Play is projected to reach $233 billion by the end of 2026. But, you need a deep understanding of modern dynamics to capture a share of this growth.
Free Apps vs. Paid Apps
Paid downloads have become a relatively small part of the mobile ecosystem. The existing research reports that approximately 97.01% of Google Play apps and 95.24% of Apple App Store apps are free to download.
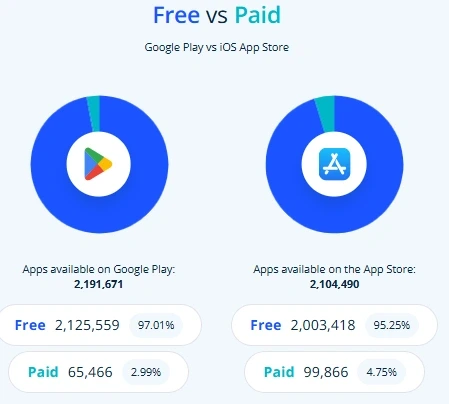
This does not mean free applications cannot generate revenue. Instead, free distribution allows businesses to acquire users and then monetise them through:
- In-app purchases
- Subscriptions
- Advertising
- Premium functionality
- Other post-install models
The model works because removing the initial payment barrier can increase the potential user base.
IAP Revenue
In-app purchases continue to represent one of the major revenue streams.
The existing research reports approximately $85.6 billion in IAP revenue in 2025, with projections of approximately $95 billion by the end of 2026.
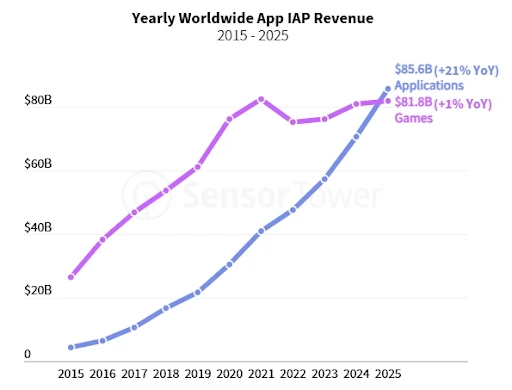
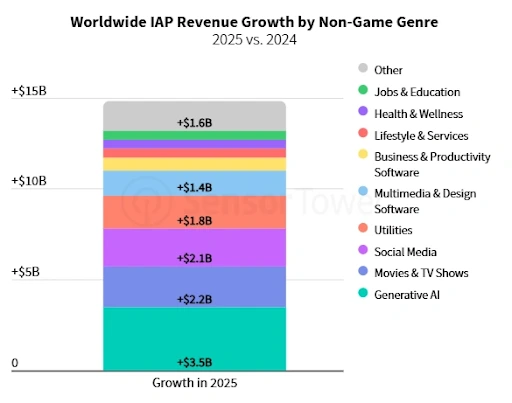
It also indicates that non-game applications surpassed games in IAP revenue in 2025. This is significant because it demonstrates how monetization is expanding beyond traditional gaming. Generative AI, entertainment, utilities, and other categories are increasingly contributing to consumer spending.
So, where is this app revenue coming from?
Take a closer look at revenue growth by segment, showcasing how consumer spending is increasing across various app categories: Entertainment, utilities, generative AI, and more. It is expected to grow and have a growing share of total app revenue year after year. Look at the chart below to know the details:
Revenue Generation by Type
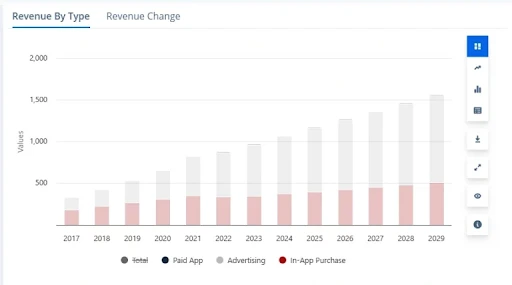
Long-term projections demonstrate the changing balance between monetization models. The existing research cites projections that by 2029:
- In-app purchase revenue could exceed $500 billion.
- Advertising revenue could exceed $1 trillion.
- Paid app downloads could remain below $50 billion.
These projections reinforce the declining importance of one-time paid downloads compared with recurring and scalable monetization models.
Business impact of these stats
Businesses should choose monetization models according to user behaviour and product value. Subscriptions may work well for products delivering recurring value. IAP can work for digital goods, premium functionality, or consumable experiences. Advertising may work when applications have substantial engagement and scale. The strongest products may also combine multiple monetization models rather than relying on a single revenue stream.
Mobile App Industry Trends Shaping 2026 and Beyond
Hopefully, the mobile app industry’s recent data and insights mentioned above clearly convey how the end users download apps, engage with them, and drive growth in various regions. However, these numbers alone do not explain why this shift is happening. You should look at the following latest mobile app industry trends:
AI-Driven Experiences
Apps are no longer static interfaces, and in fact, users now expect apps to adapt to their behaviour, preferences, and context. AI in the custom app development process is increasingly embedded across recommendation engines, onboarding flows, customer support, and content personalization.
Rather than offering generic experiences, successful apps continuously learn from user interactions to deliver more relevant outcomes. Companies must move beyond rule-based logic and invest in intelligent systems that improve user experience over time. Apps that feel intuitive and personalised gain higher engagement and loyalty.
Why AI Matters
- Personalised recommendations increase engagement levels
- AI-powered onboarding improves activation rates
- Predictive analytics improves retention
- Converzational AI enhances customer support
Super App Development
Users are experiencing app fatigue, managing too many single-purpose applications. This has led to a rise in super apps and feature consolidation, where multiple services coexist within a single ecosystem. Payments, communication, commerce, and services are increasingly accessible from one platform, often supported by reliable application modernization services that help integrate and scale multiple functionalities within a unified experience.
Rather than building overly complex standalone apps, businesses should consider modular product design, partnerships, or ecosystem-based growth strategies that reduce friction for users.
Key Drivers Behind Super Apps
- Increased user value and business value
- Cross-platform engagement growth metrics
- Reduced friction rate and app switching
- Demand for all-in-one digital ecosystems
Privacy-First App Design
With growing awareness around data usage, users are increasingly selective about which apps they trust. Transparent data practices, clear permissions, and ethical data handling are no longer optional; they directly influence adoption and long-term engagement.
Trust is now part of the product experience. Apps that clearly communicate how data is used and respect user privacy build stronger relationships and reduce churn.
Privacy Trends to Watch
- Increased demand for transparent data policies
- Privacy influencing install decisions
- Regulations shaping product design
- Trust becoming a competitive differentiator
Subscription Models
Subscription fatigue is pushing businesses to rethink pricing and value delivery. Users expect clarity, flexibility, and tangible benefits in exchange for recurring payments. Rigid paywalls and unclear pricing structures are losing effectiveness.
Successful apps focus on flexible plans, freemium access, and clear value progression instead of aggressive monetization tactics.
Top Shifts in Subscription Strategy
- Freemium models that are driving user adoption
- Hybrid monetization models are emerging
- Flexible pricing tiers are gaining popularity
- Value-driven user retention is replacing hard paywalls
App Performance Quality
Performance, speed, and simplicity are now core differentiators. Users are far less tolerant of slow load times, confusing navigation, or cluttered interfaces. Even feature-rich apps struggle if usability is compromised.
Product teams must prioritise app UX design, performance optimization, and usability testing. Apps that feel fast, intuitive, and reliable consistently outperform competitors in retention and ratings.
Performance-Related User Priorities
- Faster load times improve retention
- UX simplicity reduces churn
- App ratings strongly tied to performance
- Continuous testing becoming a standard practice
Wrapping Up
The latest mobile app statistics show an industry that is still expanding, but the definition of success is changing. The global mobile application market is projected to reach hundreds of billions of dollars in 2026, while users spend more than five trillion hours inside mobile applications each year. App downloads continue to grow, generative AI is creating new demand, and categories such as gaming, social media, ecommerce, fintech, and health and wellness continue to develop distinct monetization and engagement models.
At the same time, retention remains one of the biggest challenges. Millions of downloads have limited business value if users uninstall an application shortly after installation. This makes product quality, onboarding, performance, personalization, privacy, and long-term value essential components of a successful mobile strategy.
The mobile app development statistics also point toward a more mature market. Businesses are no longer simply asking whether they should build an app. They need to determine which platform to prioritise, which market to enter, what category-specific behaviour to address, how to monetise users, and how to create an experience that earns repeat engagement. For businesses building a mobile product in 2026, the opportunity is significant, but so is the competition.
The right product strategy needs to connect market demand with scalable technology, user experience, security, performance, and measurable business outcomes. If you are evaluating your next mobile product, you can partner with a custom application development company to turn these market insights into a practical product and development roadmap.

FAQs
Q1. How much will the mobile app market be worth in 2026?
The global mobile app market is projected to reach approximately $391.3 billion in 2026, according to Mordor Intelligence. Other market research estimates place the 2026 value at a similar level, with long-term growth expected as smartphone adoption, in-app spending, subscriptions, and mobile services continue expanding.
Q2. What is the average number of apps a person uses daily in 2026?
Global users spend approximately 4.2 hours per day using mobile applications. Although users may have many apps installed, daily activity tends to concentrate around a smaller group of frequently used applications, particularly social, communication, payment, entertainment, and utility apps.
Q3. How has 5G impacted mobile app download sizes?
5G provides faster speeds and lower latency, making users more comfortable downloading and using larger applications. This particularly benefits gaming, streaming, AR, and other media-heavy experiences. Faster networks can support richer application experiences while reducing the friction associated with downloading larger files.
Q4. Which platform (iOS vs. Android) has the highest consumer spend in 2026?
iOS has the higher consumer spending level, despite Android having greater global reach. The existing research reports that iOS generates more than 65% of global app revenue. Stronger spending among iOS users makes the platform particularly relevant for premium applications, subscriptions, and in-app purchase strategies.
Q5. What percentage of mobile time is spent in apps vs. browsers?
Mobile applications account for the overwhelming majority of smartphone usage time. The existing research places app usage at more than 90% of mobile time, demonstrating that applications remain the primary interface for digital services, entertainment, communication, transactions, and everyday mobile interactions.
Q6. Why do most mobile apps fail/get uninstalled?
Many apps lose users because they fail to demonstrate value quickly. Common problems include confusing onboarding, excessive permission requests, mandatory registration, poor performance, unclear functionality, and excessive notifications. Strong retention requires reducing time to value and continuously improving the experience after installation.
Q7. How much does it cost to build a mobile app?
The cost of building a mobile app depends on factors such as product complexity, features, platform requirements, UI/UX, integrations, security, backend architecture, and development approach. A simple application requires a very different investment from a complex fintech, healthcare, ecommerce, or AI-powered product, so costs should be evaluated against the specific product scope.
Q8. What’s a good app retention rate benchmark by category?
There is no single retention benchmark that applies to every application category. Existing Day-30 Android benchmarks cited in the research range from approximately 3.1% for finance apps to 9.9% for news and magazine apps. Businesses should therefore compare retention against their specific category, acquisition channel, audience, and product model rather than using one universal target.

SHARE
WRITTEN BY

Ishan Gupta
CEO & Founder
Ishan Gupta is a seasoned entrepreneur and CEO with extensive 8+ years of experience in business and mobile app development landscape. He believes that the right digital product allows companies to focus on what they do best, while technology handles the rest. With deep exposure to global markets, he understands what makes an app succeed. His approach translates business needs into clear product strategies, ensuring that every feature contributes to measurable ROI.
View All Articles






 India
India USA
USA Australia
 Canada
 UK
UK UAE
UAE