


Key Takeaways
- Custom dashboard development helps businesses consolidate fragmented data, monitor KPIs, and improve decision-making through centralised, actionable insights.
- Choosing between building and buying depends on customisation needs, integration complexity, budget, scalability, and long-term business objectives.
- Real-time cloud dashboard architecture requires reliable data pipelines, suitable processing models, secure integrations, and continuous performance monitoring.
- Dashboard development costs vary with features, integrations, security requirements, data processing complexity, and ongoing infrastructure and maintenance expenses.
- Measuring dashboard ROI requires tracking reporting time saved, reduced errors, operational efficiency improvements, and total cost of ownership.
Business leaders rarely struggle with a lack of data. The real challenge is turning information scattered across customer relationship management (CRM) platforms, enterprise resource planning (ERP) systems, financial software, cloud infrastructure, and operational applications into decisions that improve business performance. When teams rely on disconnected reports and spreadsheets, even basic questions about revenue, operational efficiency, customer retention, and resource utilisation can require hours of manual analysis.
A well-designed dashboard brings relevant information together in a single interface, helping decision-makers monitor key performance indicators (KPIs), identify emerging problems, and act on reliable insights. However, businesses must make an important technology decision before investing: should they purchase an existing dashboard platform, develop a custom solution, or combine both approaches?
Custom dashboard development offers greater control over workflows, integrations, visualisation, and business-specific requirements. Buying an established platform can provide a faster implementation path and reduce the need to maintain an entire software product internally. The right choice depends on the organisation’s reporting requirements, technical capabilities, long-term costs, and strategic objectives.
Businesses must also determine whether they need scheduled reporting or a real-time dashboard capable of processing frequent updates from operational systems. Cloud infrastructure, data pipelines, security controls, and scalable architecture all influence how effectively a dashboard performs as data volumes and user expectations grow.
For organisations evaluating a tailored solution, an experienced admin dashboard development company can help translate business requirements into a practical dashboard strategy, from KPI mapping and interface design to integrations and deployment. This guide explains how dashboard development works, when to build versus buy, which cloud architecture to consider, how much development and ongoing operations may cost, and how business leaders can calculate dashboard ROI before committing significant resources.
Table of Contents
What is Custom Dashboard Development?
Custom dashboard development is the process of designing and building a software interface that presents business data in a structured, interactive, and decision-oriented format. Instead of forcing teams to work within the fixed reporting options of a standard platform, a custom dashboard is designed around specific business objectives, data sources, user roles, and operational workflows.
A dashboard may combine information from several applications, including CRM systems, accounting software, inventory management platforms, marketing tools, customer support applications, and cloud monitoring services. The information is processed and presented through charts, tables, KPI cards, filters, alerts, and other visual elements.
For example, an executive dashboard for an ecommerce business could combine sales revenue, order fulfilment, advertising expenditure, inventory availability, and customer retention data. A business leader could use this consolidated view to identify declining profitability or a potential supply chain problem without switching between multiple applications. The purpose is not simply to display more data. It is to make important information easier to interpret and act upon.
How Does a Business Dashboard Work?
A typical business dashboard follows a data-to-decision workflow. Data is collected from databases, APIs, SaaS development process, and internal software. The information is then validated, cleaned, transformed, and stored in a suitable database or analytical system. The frontend presents relevant metrics through charts, tables, KPI cards, and interactive controls. Users can filter information, investigate trends, and respond to alerts.
The architecture can be relatively simple for a dashboard that updates once a day. A dashboard monitoring financial transactions, delivery operations, or infrastructure incidents may require more sophisticated processing and faster data delivery.
Custom Dashboard Development vs Standard Dashboard Configuration
Configuring an existing platform involves using its built-in reporting features, supported connectors, and customisation options. Custom development involves creating some or all of the software components specifically for the organisation.
A tailored solution is useful when the business requires unique calculations, specialised workflows, multiple legacy integrations, or a differentiated user experience. Configuration is often sufficient when reporting needs are standard, and the platform already supports the required data sources. Businesses can also combine these approaches by using an established analytics platform while building custom integrations or application-specific interfaces.
Why Businesses Need Custom Dashboards in 2026
Business operations increasingly depend on information distributed across different applications. As organisations adopt more SaaS products, cloud services, and specialised software, it becomes harder to maintain a consistent view of performance.
A management dashboard can address this problem by consolidating important metrics, but its value depends on the quality of the underlying data and the decisions it supports.
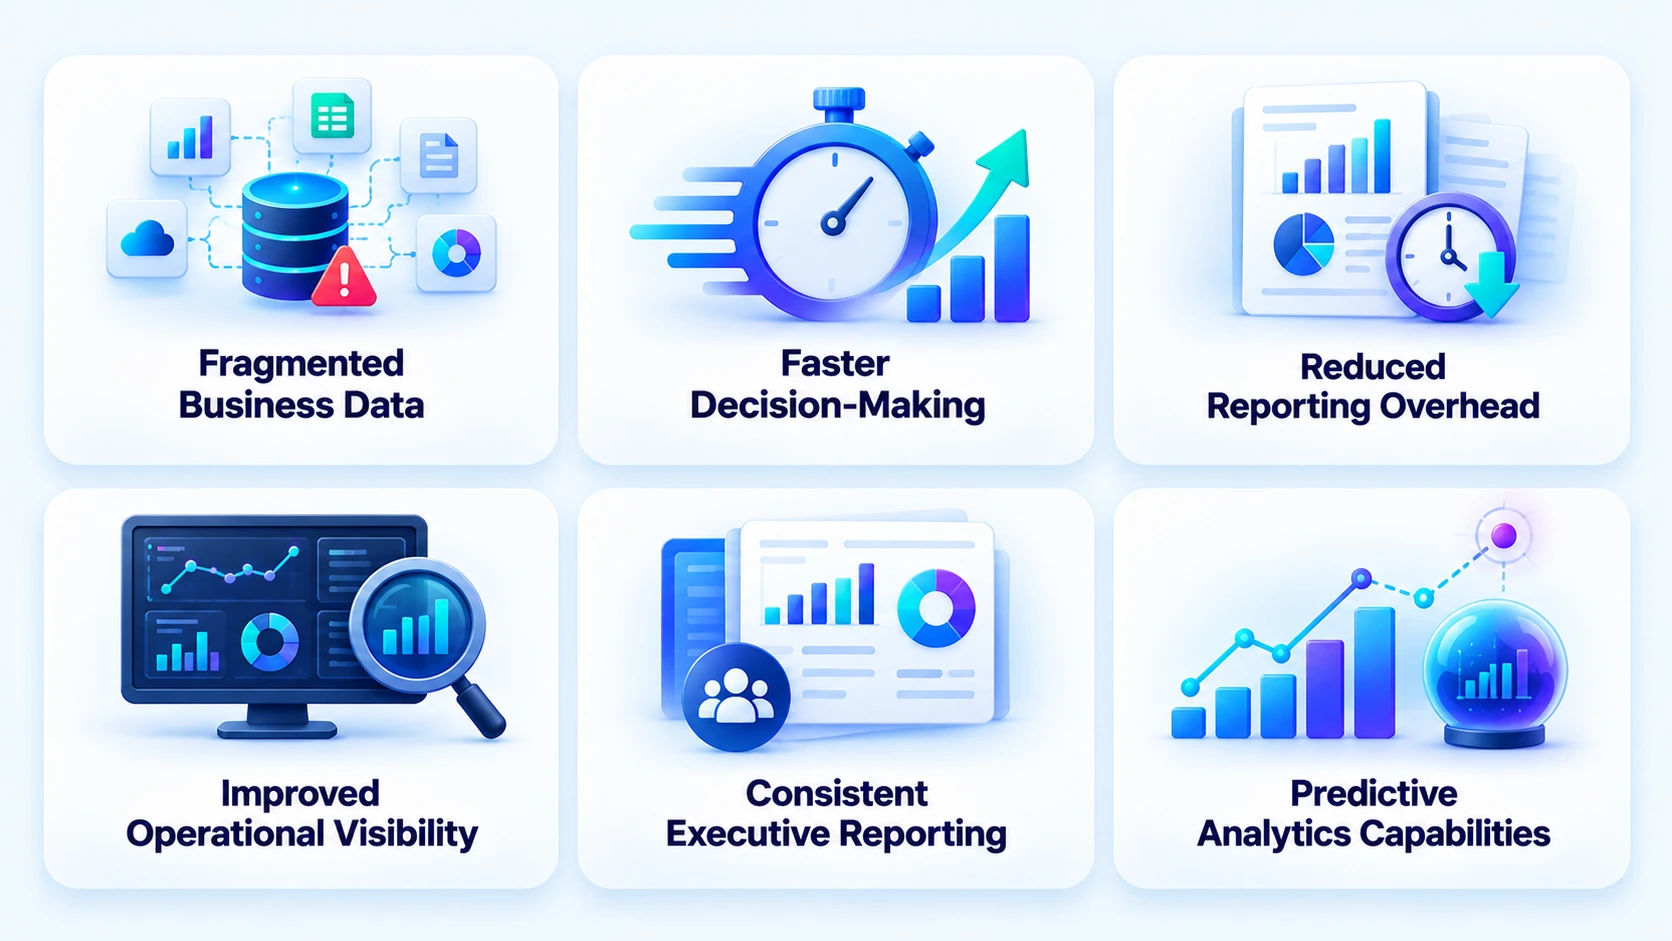
1. Fragmented Business Data
Sales teams may use one platform, finance teams another, and operations teams a separate application. Each system can define metrics differently, update on different schedules, and maintain its own reporting structure. Without a common reporting layer, business leaders may receive conflicting figures for revenue, active customers, operational expenditure, or outstanding orders. A consolidated dashboard can bring these sources together and apply agreed definitions to critical KPIs.
2. Faster Decision-Making
Manual reporting often introduces delays between a business event and the moment decision-makers become aware of it. For example, a retail operations manager might discover a stock shortage only after receiving a daily report. A dashboard with frequent inventory updates and threshold-based alerts could identify the issue sooner.
The required update frequency depends on the decision. A daily revenue summary may be sufficient for an executive review, while a payment failure dashboard may need updates within seconds or minutes.
3. Reduced Reporting Overhead
Teams frequently spend time exporting spreadsheets, cleaning datasets, reconciling figures, and preparing recurring presentations. Dashboard automation can reduce repetitive work by refreshing data automatically, standardising calculations, and providing reusable reporting views.
Employees can then spend more time investigating performance and less time assembling information. The savings should be measured against actual reporting hours before and after implementation rather than assumed from the existence of the dashboard.
4. Better Operational Visibility
An operational dashboard helps teams monitor day-to-day activities such as transaction processing, order fulfilment, customer support response times, application availability, and resource utilisation. When a metric moves outside an acceptable range, alerts can direct attention towards the affected process.
This is particularly useful for organisations operating across multiple locations, departments, or digital channels.
5. More Consistent Executive Reporting
An executive dashboard can create a common view of organisational performance by bringing together revenue, profitability, customer acquisition, retention, productivity, and operational indicators.
However, executive reporting should not overwhelm leaders with every available metric. It should prioritise indicators connected to strategic objectives and provide drill-down options for investigating exceptions.
6. Greater Scope for Predictive Analytics
Advanced dashboards can incorporate forecasting, anomaly detection, and AI-assisted analysis. For example, a dashboard may highlight unusual spending patterns, estimate demand based on historical trends, or identify an unexpected increase in customer cancellations.
These capabilities depend on data quality, suitable analytical models, and appropriate validation. AI-generated explanations should not be treated as automatically accurate or as a replacement for business judgement.
What are the Different Types of Business Dashboards?
Different teams need different views of the same organisation. Selecting the right dashboard type begins with identifying who will use it, which decisions they make, and how frequently the underlying information changes.
| Dashboard type | Primary users | Typical KPIs | Main objective |
| Strategic dashboard | Executives and directors | Revenue growth, profitability, retention, strategic targets | Monitor long-term performance |
| Operational dashboard | Operations and service teams | Order status, processing time, incidents, inventory levels | Manage daily activities |
| Analytical dashboard | Analysts and business intelligence teams | Trends, segmentation, correlations, historical comparisons | Investigate performance drivers |
| Financial dashboard | Finance leaders and controllers | Cash flow, expenses, margins, receivables | Improve financial visibility |
| Sales dashboard | Sales managers and account executives | Pipeline value, conversion rates, deal velocity | Improve sales execution |
| Customer dashboard | Customer success and marketing teams | Churn, customer lifetime value, acquisition cost | Understand customer behaviour |
| Cloud monitoring dashboard | IT and engineering teams | Latency, errors, CPU utilisation, availability, cloud spend | Maintain application and infrastructure health |
Strategic Dashboards
A strategic dashboard focuses on organisational goals and long-term business performance. It typically presents a limited set of high-level metrics that allow leadership teams to compare actual results with targets.
For example, a SaaS company might track annual recurring revenue, net revenue retention, customer acquisition cost, gross margin, and customer churn. The dashboard should show trends, highlight deviations, and provide enough context to help executives decide whether to adjust budgets, staffing, or growth priorities.
Operational Dashboards
An operational dashboard supports immediate or short-term decisions. It may track current transactions, pending orders, support queues, manufacturing output, or system incidents.
These dashboards often require more frequent data refreshes than strategic dashboards. Their value depends on accurate status information, clear alerts, and the ability to investigate exceptions quickly.
Analytical Dashboards
An analytical dashboard helps users explore why a metric changed. It can include historical comparisons, filters, segmentation, and drill-down functionality.
For instance, a sales analyst may compare conversion rates by region, acquisition channel, customer segment, and sales representative. Analytical dashboards may rely on a data warehouse and precomputed datasets to support complex queries without slowing down operational systems.
Financial Dashboards
Financial dashboards consolidate information about revenue, expenditure, cash flow, accounts receivable, budgets, and profitability.
A finance team may use them to compare actual spending against budgets, identify overdue payments, and understand which business units are contributing most to operating costs. Financial metrics require consistent accounting definitions and appropriate access controls. A dashboard cannot compensate for inaccurate source records or inconsistent financial reconciliation.
Customer and Sales Dashboards
Customer and sales dashboards help organisations understand the relationship between acquisition, conversion, retention, and revenue.
A dashboard may connect CRM data with marketing analytics, subscription records, and support information. This allows teams to investigate which channels generate valuable customers and where opportunities are being lost.
Cloud and IT Monitoring Dashboards
A cloud monitoring dashboard provides visibility into application health, infrastructure utilisation, service availability, response times, and cloud expenditure.
Engineering teams can use it to identify performance degradation, investigate failed deployments, and monitor resource consumption. For businesses managing several applications or cloud environments, consolidated monitoring can help teams understand dependencies that would otherwise remain hidden across separate tools.
What Features Should a Business Dashboard Include?
Dashboard features should be prioritised according to business needs rather than added simply because they are technically available.
- Customisable KPI cards and visualisations: Highlight important figures such as revenue, conversion rates, active users, and outstanding orders. Use charts and tables to provide context and support comparisons.
- Real-time or scheduled data updates: Select a refresh frequency based on how quickly users need to act. More frequent updates can increase processing, infrastructure, and integration costs.
- Filters and drill-downs: Allow users to examine information by date, department, location, product, or customer segment and investigate the underlying records.
- Role-based access control: Ensure users see information appropriate to their responsibilities. Sensitive information should be protected through server-side authorisation, not merely hidden in the interface.
- Alerts and notifications: Notify users when metrics cross defined thresholds. Advanced implementations can use anomaly detection, but alerts should be designed to avoid excessive notifications.
- Business system integrations: Connect CRM, ERP, finance, inventory, customer support, marketing, and cloud monitoring systems according to business requirements.
- Responsive design: Make essential metrics and actions accessible across different screen sizes without simply shrinking a complex desktop interface.
- Exportable reports and scheduled summaries: Support PDF exports, spreadsheet downloads, and scheduled reports while enforcing appropriate access permissions.
- Audit logs and data governance: Record important access and configuration changes while maintaining consistent KPI definitions, data ownership, and retention rules.
- AI-assisted insights: Summarise trends, identify unusual movements, or help users explore data through natural-language questions, subject to suitable validation and access controls.
Read More: Web Application Features Checklist For Modern Businesses: Security, AI & Scalability Essentials
Custom Dashboard Development vs Off-the-Shelf Software
The build-vs-buy decision is not simply a comparison between expensive custom software and an inexpensive subscription. It is a choice between different ways of meeting business requirements, controlling costs, managing technical risk, and supporting future growth. The most suitable option depends on how closely existing platforms match the organisation’s needs.
What Does Building a Custom Dashboard Involve?
Building a custom dashboard begins with understanding the business decisions the product must support. Stakeholders define the KPIs, identify data sources, agree on access permissions, and prioritise the workflows that matter most.
The development process usually includes requirements discovery and KPI mapping, interface design and prototyping, frontend and backend development, database design, data integration, analytics pipelines, authentication, security, testing, deployment, monitoring, and maintenance.
A tailored dashboard can provide a consistent experience across several systems, but the organisation must plan for ongoing updates and operational responsibility.
What Does Buying a Dashboard Platform Involve?
Buying an existing dashboard platform generally involves subscribing to a software product and configuring it for the organisation. The platform may provide prebuilt connectors, templates, visualisation tools, permissions, and reporting features. Implementation still requires work to connect data sources, configure metrics, establish access rules, and validate calculations.
The business must also evaluate subscription tiers, user limits, data volume charges, premium connectors, support arrangements, and restrictions on exporting or accessing data. A lower entry price does not automatically mean a lower long-term cost.
Build vs Buy: Side-by-Side Comparison
| Evaluation factor | Custom dashboard | Off-the-shelf platform |
| Initial investment | Usually higher | Usually lower |
| Time to launch | Depends on scope | Generally faster |
| Customisation | High | Depends on available features |
| Integration flexibility | Tailored to requirements | Limited by supported connectors and APIs |
| Scalability | Designed around expected workloads | Depends on vendor architecture and plan |
| Ownership and control | Greater control over custom components | Vendor-dependent |
| Maintenance | Internal team or development partner | Vendor and customer responsibilities vary |
| Pricing model | Development plus operating costs | Subscription and usage charges |
| Vendor dependency | Depends on chosen components and hosting | Often significant |
| Long-term economics | Depends on complexity and maintenance | Depends on subscription growth and usage |
When Should You Build a Custom Dashboard?
Custom development is worth considering when the dashboard must support business requirements that existing tools cannot meet efficiently.
1. Your Business Has Unique KPIs
A business may need calculations based on proprietary pricing models, specialised operational rules, or industry-specific performance measures. If standard platforms cannot represent these metrics accurately without complicated workarounds, custom development can provide a cleaner implementation.
2. Multiple Legacy Systems Need Integration
Established businesses often operate with a mixture of modern cloud applications, internal databases, older enterprise software, and specialised third-party systems. A custom dashboard can create a unified reporting layer across these systems, provided that the necessary data can be accessed securely and reliably. Businesses planning broader integration work may also benefit from reviewing the custom software development guide to understand the wider planning considerations involved in building software around specific operational requirements.
3. The Dashboard Supports a Revenue-Generating Product
A dashboard may be part of a customer-facing SaaS application, a partner portal, or a paid analytics service. In these cases, the interface, access model, and analytics capabilities can directly affect the product’s value proposition. Greater control over the user experience and product roadmap may justify the investment in custom development.
4. You Need Greater Control Over Data and Workflows
Businesses operating under specific security, governance, or contractual requirements may need more control over data flows, permissions, deployment options, and system behaviour. Custom development can support these requirements, although compliance still depends on the complete implementation, operational processes, and applicable regulations.
5. You Have Outgrown Existing Tools
Consider a company that initially uses a standard dashboard platform to monitor sales and marketing performance. As it grows, it needs to combine inventory, fulfilment, finance, customer support, and supplier data. If the platform cannot accommodate the required workflows or the cost of additional capabilities becomes excessive, a custom or hybrid approach may become more practical.
When Should You Buy an Existing Dashboard Platform?
Buying is often the better decision when the business needs reliable reporting quickly and the requirements are already well supported by established products.
1. Reporting Requirements Are Standardised
If the organisation primarily needs charts, filters, scheduled reports, and common business metrics, a mature platform may already provide everything required. Building these features from scratch would introduce additional cost without necessarily creating meaningful differentiation.
2. Speed to Market Is a Priority
An existing platform can reduce the time required to establish basic reporting capabilities. This can be particularly valuable when a business needs an initial dashboard for a management review, a new operational process, or an early-stage product.
3. Supported Integrations Already Exist
Buying becomes more attractive when the platform provides reliable connectors for the organisation’s most important data sources. However, businesses should test the connectors against actual data volumes, update frequencies, authentication requirements, and transformation needs before committing.
4. Internal Engineering Capacity Is Limited
A subscription-based solution may reduce the amount of engineering work required to maintain dashboard infrastructure. The organisation still needs people who understand data definitions, permissions, configuration, and reporting quality, but it may not need a dedicated team to maintain a custom application.
5. The Business Needs Predictable Initial Spending
Subscription pricing can make initial budgeting easier, particularly when the number of users and required capabilities are clearly defined. Finance teams should still assess how costs may change as users, data volumes, integrations, and premium features increase.
When Does a Hybrid Build-and-Buy Approach Make Sense?
A hybrid approach combines existing software with custom-built components. It is often a practical option for businesses that need specialised integrations or workflows but do not want to recreate the entire analytics stack.
For example, an organisation could use a commercial BI platform for visualisation while developing custom data pipelines to connect legacy systems. Another business might build a branded dashboard interface while relying on managed cloud databases, authentication services, and analytics infrastructure.
The advantage is that teams can focus custom development on the areas that create the most business value. The trade-off is that hybrid systems introduce dependencies between products, APIs, licensing arrangements, and custom code. These dependencies must be documented and maintained.
Custom Web Application vs SaaS: Which Approach Fits?
A dashboard can be delivered as a standalone application, embedded in an existing product, or configured within a SaaS platform. When comparing custom web app vs SaaS, a standalone custom application offers greater control over its workflows and experience. A SaaS solution can reduce implementation effort and shift some infrastructure responsibilities to the vendor.
Businesses can compare both approaches to understand which solution best aligns with their operational needs, budget, customisation requirements, and long-term growth plans.
How to Evaluate Dashboard Development Requirements Before Choosing
A reliable build-vs-buy decision starts with a structured requirements assessment.
Identify Stakeholders and Business Decisions
List the people who will use the dashboard and the decisions they need to make. An executive may need to monitor quarterly profitability, while an operations manager needs to investigate delayed orders. These users should not necessarily share the same default view.
For each audience, define the questions the dashboard must answer and the actions users should be able to take.
Prioritise KPIs and Data Sources
Separate essential metrics from optional reporting requirements. For example, a first release might focus on revenue, conversion rate, order status, and operating expenditure. Additional predictive analytics and advanced segmentation can be introduced after the initial dashboard has demonstrated value.
This prioritisation prevents the project from expanding into an unnecessarily complex reporting system.
Assess Integration Complexity
Create an inventory of data sources and record available APIs and database access methods, data formats and field definitions, authentication and permission requirements, rate limits and expected data volumes, update frequency and acceptable latency, and data quality and reconciliation requirements.
Integration effort can have a significant influence on the project budget and delivery timeline.
Establish Security and Compliance Requirements
Identify sensitive data, user roles, retention requirements, audit obligations, and applicable industry regulations. Determine whether data must remain in a particular region, whether access needs to be restricted by department, and how credentials will be stored and rotated.
These requirements should inform architecture decisions from the beginning.
Define Scalability and Performance Expectations
Estimate the expected number of users, concurrent sessions, data volume, query complexity, and frequency of updates. A dashboard for twenty internal users may require a very different architecture from a customer-facing analytics product serving thousands of concurrent users.
The objective is to build sufficient capacity for realistic demand without paying for unnecessary infrastructure.
Build-vs-Buy Decision Matrix
| Criterion | Lean towards buying | Lean towards building |
| Customisation | Standard charts and filters | Unique workflows or calculations |
| Integrations | Supported connectors meet requirements | Complex or proprietary integrations |
| Delivery urgency | Immediate deployment required | Time available for a planned build |
| Engineering capacity | Limited internal resources | Suitable technical team or partner available |
| Cost structure | Subscription fits expected usage | Long-term customisation and control justify investment |
| Data control | Vendor arrangements are acceptable | Specific hosting or access controls are required |
| Strategic value | Reporting is a supporting capability | Dashboard is part of the product’s differentiation |
No single criterion should determine the outcome. The decision should reflect the combined business impact of functionality, time, cost, and risk.
What is Real-Time Dashboard Architecture?
Real-time dashboard architecture describes the components and data flows that allow a dashboard to receive, process, and display information as business events occur or shortly afterwards.
A real-time dashboard differs from a conventional scheduled report because its data is refreshed more frequently. However, real-time does not always mean instantaneous. The practical delay depends on how data is captured, processed, stored, queried, and delivered to the interface.
For some business decisions, a refresh every few minutes is sufficient. Other use cases, such as payment monitoring or application incident detection, may require updates within seconds. The important architectural decision is to establish an acceptable freshness target before choosing the technology.
Real-Time vs Near-Real-Time vs Batch Reporting
| Processing model | Typical characteristics | Suitable use cases |
| Batch processing | Data processed at scheduled intervals | Daily financial summaries and historical reports |
| Micro-batch processing | Data processed in small, frequent batches | Frequent operational reporting |
| Near-real-time processing | Short delay between events and dashboard updates | Inventory monitoring and business operations |
| Streaming processing | Continuous event processing | Transaction monitoring and time-sensitive alerts |
These categories describe broad patterns rather than guaranteed latency ranges. Actual performance depends on the data source, processing workload, network conditions, and implementation.
What are the Core Components of a Cloud-Based Dashboard Architecture?
A cloud-based dashboard typically separates data collection, processing, storage, application logic, visualisation, and monitoring into distinct components. The exact design should reflect the application’s requirements instead of following a fixed technology pattern.
Data Sources and Integration Layer
The integration layer connects the dashboard to the systems that produce business data. Common sources include CRM and ERP applications, financial and accounting systems, ecommerce platforms, internal databases, customer support software, IoT devices, cloud monitoring services, and third-party APIs. An effective ERP software development approach can help businesses ensure that enterprise systems exchange data reliably and support consistent reporting across departments.
Integrations may use scheduled API requests, database connections, webhooks, event streams, or change data capture. The right approach depends on what the source system supports. A source that provides reliable webhooks may support faster updates than one that exposes data only through periodic exports.
Data Ingestion Layer
The ingestion layer collects information and moves it into the processing environment. Batch ingestion is appropriate for periodic exports and historical datasets. Message queues and event streaming are useful when systems need to process frequent events asynchronously.
Change data capture can identify changes in supported databases and propagate them to downstream systems without repeatedly extracting entire datasets. The ingestion design should account for retries, duplicate events, failed connections, rate limits, and recovery after an outage.
Data Processing and Transformation
Raw data often contains inconsistent field names, different date formats, incomplete records, and conflicting definitions. The processing layer validates and transforms this information into a format suitable for reporting.
Typical operations include data validation and normalisation, deduplication and reconciliation, aggregation and calculation of KPIs, enrichment with reference data, handling late-arriving or corrected records, applying business rules, and identifying invalid or missing values.
For example, a business may define net revenue differently across its sales and finance systems. The processing layer should establish an agreed calculation rather than simply adding the figures together.
Data Storage Layer
The storage layer holds operational records, processed datasets, historical information, and cached results. Relational databases support structured records and transactional queries, while analytical warehouses handle large-scale reporting and aggregations. Data lakes store diverse datasets, and caching layers reduce the need to retrieve frequently requested information repeatedly. For example, a cloud-based warehouse management system can use these storage components to consolidate inventory records, order data, and warehouse activity for more efficient reporting and operational visibility.
Not every dashboard needs all these components. A small internal dashboard may work well with a relational database and a modest caching strategy. An enterprise analytics platform may benefit from separating operational workloads from analytical queries.
Backend and API Layer
The backend manages business logic, authentication, authorisation, data retrieval, and communication between the dashboard interface and underlying services. APIs should return only the information users are permitted to access, while query parameters, filters, and record identifiers must be validated on the server to prevent unauthorised access.
It also handles pagination, rate limiting, caching, and error management to keep the application responsive and reliable. Understanding web application architecture can help clarify how these components work together to support a secure, scalable, and maintainable dashboard.
Frontend and Visualisation Layer
The frontend translates processed data into charts, tables, KPI cards, alerts, and interactive controls. The interface should make the most important information easy to find while allowing users to investigate details when necessary.
For frequently refreshed dashboards, the frontend must also handle loading states, temporary disconnections, stale data indicators, and updates that arrive out of order. A visually attractive dashboard is not sufficient if its metrics are difficult to interpret or its information becomes unreliable during high workloads.
Monitoring and Observability Layer
Monitoring helps teams understand whether the dashboard and its data pipelines are functioning correctly. Useful signals include application availability, API response times, failed ingestion jobs, queue backlogs, data freshness, database query performance, error rates, cloud resource utilisation, and infrastructure spending.
Monitoring should cover both technical performance and data quality. A dashboard can be available while displaying outdated or incomplete information, so system health and data freshness need separate checks.
How Does Real-Time Data Flow Through a Dashboard?
Consider an ecommerce company that wants to monitor new orders, payment failures, and inventory availability. Its data flow could follow these steps:
- A customer places an order through the ecommerce application.
- The order system publishes an event or makes the record available through an integration.
- The ingestion service captures the information and forwards it for processing.
- The processing layer validates the order, reconciles relevant fields, and updates the appropriate dataset.
- The processed information is stored or aggregated in a database or analytical store.
- An API or streaming connection makes the updated metric available to the dashboard.
- The interface updates the relevant visualisation and displays any applicable alerts.
- Monitoring services record processing delays, failures, and data freshness.
A robust implementation must account for duplicate events, delayed messages, failed processing, and temporary network problems. If an order event is received twice, the system should not count the same order twice in its revenue metric. If a data source becomes unavailable, the dashboard should indicate that the information may be stale instead of presenting an old value as current.
The goal is not simply to refresh charts quickly. It is to ensure that the displayed information is timely, consistent, and trustworthy.
Which Cloud Architecture is Best for Custom Dashboard Development?
Different architectural patterns offer different advantages. The choice depends on application complexity, traffic patterns, integration requirements, and the team’s operational capabilities.
Monolithic Architecture
A monolithic application keeps several application components within one deployable unit. This can be suitable for an internal dashboard with a limited feature set, a small engineering team, and predictable workloads.
A monolith can be easier to develop, test, deploy, and operate than a distributed system. It does not automatically become unsuitable as the business grows, although tightly coupled components can make independent scaling and changes more difficult.
Microservices Architecture
Microservices divide an application into independently deployable services organised around distinct responsibilities. For example, an enterprise dashboard might separate user management, reporting, notifications, data ingestion, and analytics processing. However, businesses should evaluate the enterprise app development cost before choosing this architecture, as building and maintaining multiple services can require additional engineering resources and infrastructure.
This approach allows components to scale independently and reduces the need to deploy the entire application for every change. However, microservices introduce additional complexity around networking, service discovery, monitoring, deployment, distributed failures, and data consistency. They are not automatically the best choice for every dashboard, particularly when a simpler architecture can meet the same requirements.
Serverless Architecture
Serverless services allow developers to run functions or managed workloads without maintaining all the underlying server infrastructure. This can suit event-driven processing, irregular traffic, and workloads that vary significantly throughout the day.
Serverless components can reduce infrastructure management, but businesses must assess execution limits, cold-start behaviour, service quotas, monitoring, and costs at their expected workload.
Event-Driven Architecture
An event-driven architecture uses events to communicate changes between components. When an order is created or an application incident occurs, the source system can publish an event that triggers downstream processing.
This pattern can support responsive dashboards and loosely coupled integrations. It also requires careful handling of retries, duplicate events, message ordering, and eventual consistency.
Architecture Comparison
| Factor | Monolithic | Microservices | Serverless | Event-driven |
| Initial complexity | Low to moderate | High | Moderate | Moderate to high |
| Deployment model | Unified application | Independent services | Managed execution | Event-based communication |
| Scaling | Often application-wide | Service-specific | Depends on service limits | Depends on consumers and infrastructure |
| Operational overhead | Relatively low | Higher | Reduced server management | Requires event monitoring |
| Best fit | Smaller dashboards | Complex enterprise systems | Variable or event-triggered workloads | Frequent asynchronous updates |
| Main consideration | Component coupling | Distributed-system complexity | Provider constraints and usage costs | Delivery guarantees and event consistency |
A practical dashboard may combine these patterns. For example, a monolithic frontend and backend can use managed event-processing services for selected integrations without requiring every component to become a microservice.
How to Choose the Right Real-Time Data Processing Approach
The appropriate processing model depends on how quickly users need to act on new information.
Batch Processing
Batch processing collects data over a period and processes it at scheduled intervals. It is suitable for daily financial reporting, historical analysis, monthly management reports, and other use cases where immediate updates do not affect the decision.
Batch processing can reduce operational complexity and allow large datasets to be processed efficiently.
Micro-Batch Processing
Micro-batch processing groups incoming records into small batches that are processed frequently. It can be useful when a dashboard needs regular updates but does not require continuous event-by-event processing.
For example, a business might refresh inventory summaries every few minutes while processing detailed transaction records separately.
Stream Processing
Stream processing handles events continuously as they arrive. It is suitable for use cases such as transaction monitoring, time-sensitive operational alerts, and infrastructure event tracking.
Streaming can reduce data latency, but it introduces requirements for event handling, processing guarantees, state management, and monitoring.
How to Select the Right Model
Consider four questions: How quickly must the business respond to a change? How much data will arrive, and how frequently? What happens if data is delayed or temporarily unavailable? How much additional infrastructure and engineering effort is justified by faster updates?
The answers should determine whether batch, micro-batch, streaming, or a hybrid approach is appropriate.
Security, Reliability, and Performance in Cloud Dashboards
Dashboard architecture must protect business data while delivering a dependable user experience.
Identity and Access Management
Use secure authentication and role-based permissions to control access to sensitive information. Authorisation should be enforced by backend services and data access layers, not just the frontend.
Encryption and Secrets Management
Sensitive information should be protected in transit and at rest using suitable encryption controls. API keys, database credentials, and other secrets should be stored in an appropriate secrets-management system rather than embedded in application code.
API Security and Data Governance
Cloud dashboard security also depends on how data is accessed, stored, and managed. Businesses should validate requests, restrict access to authorised users, and monitor suspicious activity to protect sensitive information. Clear data governance policies help maintain consistent reporting and define how business data is accessed and retained. Following cloud application security best practices can help businesses understand the key measures needed to protect cloud-based applications and their data.
Query Optimisation and Caching
Slow queries can make a dashboard unusable even when the application is otherwise healthy. Database indexing, query optimisation, precomputed aggregations, and caching can improve response times.
Cached data should have a clear freshness policy so that users understand when figures may be outdated.
Load Balancing and Scaling
Load balancing distributes requests across available application instances. Horizontal scaling can add capacity as demand increases. However, scaling the frontend alone may not solve performance problems caused by an overloaded database or a slow external API.
Performance testing should identify bottlenecks across the complete data path.
Backup and Disaster Recovery
Define recovery objectives and procedures for restoring important application data and configurations. A dashboard should also have a recovery strategy for failed ingestion jobs, corrupted datasets, and unavailable dependencies.
Cloud Infrastructure Selection
Choosing the right cloud provider is essential for ensuring your business dashboard remains secure, reliable, and cost-effective as your requirements evolve. AWS, Microsoft Azure, and Google Cloud offer different services for data storage, application deployment, security, and scalability.
Comparing AWS, Azure, and Google Cloud can help you understand their differences and identify the platform that best fits your dashboard’s workload, existing technology stack, budget, and security requirements. The right choice should support your current needs while leaving room for future growth without adding unnecessary infrastructure costs.
How Much Does Custom Dashboard Development Cost?
The cost of custom dashboard development depends on the number of features, integrations, user roles, data processing requirements, security controls, and deployment expectations. A dashboard that displays a handful of metrics from one database is significantly different from an enterprise dashboard that combines multiple systems, processes streaming events, supports complex permissions, and requires high availability.
The following figures are illustrative planning estimates in US dollars, not verified market averages or quotations. Actual costs depend on the project scope, delivery team, location, technology choices, and contractual arrangements.
| Dashboard complexity | Illustrative development budget | Typical scope |
| Basic business dashboard | $5,000 – $15,000 | Core KPIs, standard charts, limited data sources |
| Mid-level custom dashboard | $15,000 – $50,000 | Multiple integrations, role-based access, advanced filters |
| Enterprise-grade dashboard | $50,000 – $150,000 | Complex integrations, advanced security, high availability, real-time processing |
These ranges are intended to help businesses begin budget discussions. They should not be interpreted as fixed pricing, and projects with substantial data engineering, regulatory requirements, or complex product functionality may fall outside them.
Basic Business Dashboard
A basic dashboard may include a small number of KPI cards, standard charts, filters, user authentication, and a few data integrations. For example, a small business might need to consolidate sales and customer data from two existing applications.
The project may not require a dedicated streaming architecture, advanced analytical models, or a complex permission system.
Mid-Level Custom Dashboard
A mid-level dashboard may combine several business applications and provide different views for executives, managers, and operational teams. It may include advanced filtering, automated reporting, more sophisticated data transformation, role-based access, and integration monitoring.
The effort depends heavily on the condition of the source data and the availability of reliable APIs.
Enterprise-Grade Real-Time Dashboard
An enterprise dashboard may require continuous data ingestion, high availability, advanced access controls, audit trails, complex analytical queries, and monitoring across several systems. These capabilities are particularly important for types of enterprise applications such as ERP platforms, supply chain management systems, financial management software, and customer relationship management solutions, where teams depend on accurate and timely information to make business decisions.
Such dashboards may also require infrastructure designed to handle large data volumes and high numbers of concurrent users. These requirements can increase development and operating costs, especially when the application needs strict recovery objectives, advanced security measures, or specialised compliance controls.

What Factors Affect Dashboard Development Costs?
UI/UX Design and Customisation
A simple reporting interface requires less design work than a complex dashboard supporting multiple user roles, workflows, and detailed data exploration. The design effort should focus on information hierarchy, usability, accessibility, and the actions users need to perform.
Number and Complexity of Data Integrations
Every additional integration introduces potential work involving authentication, API mapping, error handling, data transformation, testing, and maintenance. An integration with a well-documented API may be straightforward. A legacy system with inconsistent records and limited access options may require considerably more effort.
Real-Time Processing Requirements
Frequent data updates may require event ingestion, streaming infrastructure, message queues, state management, and more extensive monitoring. If the business only needs daily reporting, adding a continuous streaming architecture may increase costs without producing meaningful additional value.
Database and Cloud Infrastructure
Database selection, data retention, storage volume, compute requirements, network traffic, and redundancy all affect operating expenses. A scalable design should accommodate expected demand while avoiding unnecessary resources.
AI and Predictive Analytics
Forecasting, anomaly detection, and natural-language data exploration introduce additional requirements for data preparation, model evaluation, integration, and ongoing monitoring. For example, data analytics in sports can help teams analyse player performance, identify patterns in match statistics, forecast outcomes, and support data-driven coaching decisions. These capabilities should be introduced when they solve specific business problems rather than being included simply to make the dashboard appear more advanced.
Security and Compliance
Security requirements may involve advanced identity management, audit logging, data isolation, encryption, penetration testing, and specialised compliance processes. The cost depends on the sensitivity of the data, the regulatory environment, and the controls required.
Testing, Deployment, and Maintenance
Testing must validate both the software and the information it displays. Incorrect KPI calculations can undermine business decisions even when the interface works correctly. Testing should therefore include data reconciliation, permissions, performance, usability, and recovery scenarios.
What are the Ongoing Costs of Running a Cloud Dashboard?
Initial development is only one part of the financial commitment. A realistic budget includes recurring expenses throughout the dashboard’s operational life.
| Cost category | What it covers | Cost drivers |
| Cloud compute | Application servers and processing workloads | Traffic, CPU, memory, execution time |
| Storage | Databases, analytical datasets, logs, backups | Data volume, retention, redundancy |
| Data transfer | Network traffic between services and users | Data volume and architecture |
| Processing | Streaming, scheduled jobs, transformations | Event frequency and workload |
| Licences | BI platforms, monitoring tools, third-party APIs | Users, usage tiers, premium features |
| Security | Identity services, audits, testing, monitoring | Risk and compliance requirements |
| Maintenance | Bug fixes, upgrades, compatibility changes | System complexity and release frequency |
| Support | Incident response and technical assistance | Coverage hours and service expectations |
A business should estimate these costs over an agreed period, such as three years, rather than comparing development quotes alone.
How to Calculate Dashboard Total Cost of Ownership
Total cost of ownership (TCO) represents the complete cost of acquiring, implementing, operating, maintaining, and eventually replacing a solution over a defined period. For a purchased platform, the model should include subscriptions, configuration, connectors, premium features, training, and internal administration.
For a custom dashboard, it should include development, infrastructure, maintenance, security updates, monitoring, and support. Where relevant, businesses should also account for migration, integration replacement, vendor exit costs, and the opportunity cost of engineering resources.
Cloud costs are another factor to consider when managing dashboard infrastructure. Repeated database queries, unnecessary storage, and unused computing resources can increase expenses over time. Businesses can control these costs by optimising queries, adjusting resources according to demand, and monitoring storage and data transfer charges. Following effective cloud cost optimization practices can help businesses use infrastructure resources efficiently and reduce unnecessary spending as their dashboards scale.
How to Calculate the ROI of Custom Dashboard Development
Return on investment (ROI) helps business leaders evaluate whether the measurable benefits of a dashboard justify its cost. Potential benefits include reduced manual reporting, fewer data errors, improved resource allocation, faster identification of operational problems, and increased visibility into revenue opportunities.
However, not every benefit can be converted into a reliable financial figure. Improved visibility, for example, is not automatically equivalent to additional revenue. The business must identify a measurable outcome and establish a reasonable method for attributing the improvement to the dashboard.
Dashboard ROI Formula
For this version, first-year total costs include the initial implementation investment and first-year operating expenses. This makes the calculation useful for evaluating the first-year financial outcome relative to the upfront investment. Businesses can also calculate ROI over a longer period, provided they define the time horizon and account for all relevant costs and benefits consistently.
Benefits to Include in the Calculation
- Reduced manual reporting hours: Estimate how much staff time is saved and multiply the verified hours by the relevant fully loaded labour cost.
- Lower reporting and reconciliation costs: Include measurable reductions in external reporting work, duplicate processes, or manual data preparation.
- Improved operational efficiency: Quantify verified reductions in overtime, avoidable rework, or processing costs.
- Reduced errors: Include only errors with measurable financial consequences and a defensible link to the dashboard.
- Revenue improvements: Count incremental revenue or contribution margin only when the business can reasonably attribute the improvement to actions supported by the dashboard.
Avoid counting the same benefit twice. For example, if saved reporting hours are already valued as labour savings, do not include those same hours again as a separate productivity benefit.
Why TCO and ROI Should Be Evaluated Together
A dashboard with a lower initial cost may become more expensive over time because of licensing, user-based pricing, premium integrations, or usage charges. A custom dashboard may require a larger initial investment but offer a more suitable cost structure for specific workflows or large numbers of users.
Neither option is automatically cheaper. The decision should compare total cost over the same time horizon, measurable benefits and expected adoption, implementation risk and time to value, data access and integration limitations, maintenance and support responsibilities, and flexibility to accommodate future requirements.
A reliable business case uses the same assumptions for both options and makes uncertainty visible.
How to Develop a Custom Business Dashboard Step by Step
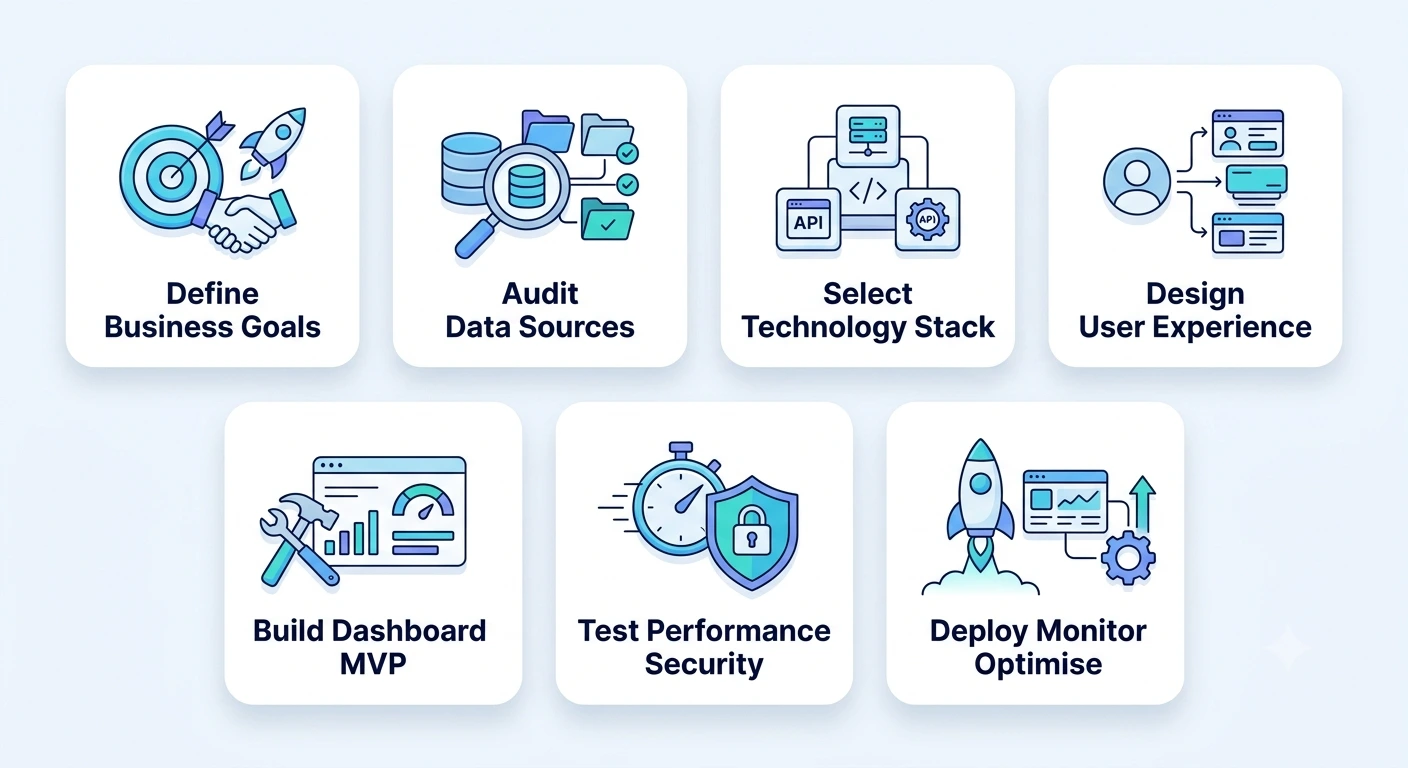
A successful dashboard project connects business objectives, data quality, architecture, usability, and operational planning. The following process provides a practical way to move from requirements to a production-ready solution.
1. Define Business Goals and KPIs
Start by identifying the business problems the dashboard must solve. Determine which decisions should become faster, which processes need better visibility, and which performance measures will indicate success.
Each KPI should have an agreed definition, a data owner, a reporting frequency, and a clear relationship to a business objective. Avoid collecting metrics simply because they are available.
2. Audit Data Sources and Infrastructure
Document the systems that contain relevant information and determine how data can be accessed. Assess data quality, field consistency, authentication requirements, API limits, and existing cloud infrastructure. This audit helps identify integration risks before they become expensive development problems.
3. Select the Architecture and Technology Stack
Choose the frontend, backend, database, cloud environment, and data processing model based on the requirements. For example, a simple internal dashboard may use a conventional web application architecture and scheduled data updates. A transaction-monitoring dashboard may require event streaming and more extensive observability.
The technology stack should reflect expected workloads, team expertise, security needs, and long-term maintenance requirements. Choosing the right technology stack is essential for building a dashboard that performs reliably and remains easy to maintain as business requirements evolve. The decision should account for expected workloads, integration needs, security requirements, scalability, and the development team’s expertise. These factors help ensure the dashboard remains flexible and cost-effective over time.
Read More: MongoDB vs MySQL: Which Database is Better for Your Business
4. Design the User Experience
Create wireframes and prototypes that show how users will navigate information, investigate metrics, and act on alerts. Test whether the most important KPIs are easy to find and whether users understand what each metric means.
Role-specific views can reduce unnecessary complexity, while consistent labels and visual conventions help prevent misinterpretation.
5. Build an MVP Dashboard
Begin with the smallest useful version of the dashboard. A minimum viable product (MVP) might include the highest-priority KPIs, a few critical integrations, basic permissions, and essential reporting functionality.
Validate the dashboard with real users before adding advanced analytics, predictive features, or extensive customisation. An MVP approach allows the business to test its assumptions, collect feedback, and prioritise further investment using evidence.
6. Test Performance, Accuracy, and Security
Testing should cover more than interface functionality. Validate KPI calculations against trusted source records. Test permissions, API failures, data refresh behaviour, concurrent usage, query performance, and recovery procedures.
Where a dashboard displays financial or operational information, reconciliation is particularly important because an incorrect metric can lead to costly decisions.
7. Deploy, Monitor, and Optimise
After deployment, track application health, data freshness, user adoption, and operating costs. Collect feedback from the people who rely on the dashboard and investigate which features are being used.
Review whether the dashboard has actually reduced reporting effort or improved the decisions it was designed to support. Use these findings to guide future improvements rather than treating launch as the end of the project.

Common Dashboard Development Mistakes to Avoid
Tracking Too Many Metrics
Displaying every available metric can make a dashboard difficult to use. Prioritise the KPIs that influence specific decisions and move less important information into secondary views.
Ignoring Data Quality
A dashboard can present incorrect information with excellent visual design. Establish consistent KPI definitions, validation rules, data ownership, and reconciliation procedures before relying on the output.
Overengineering Real-Time Capabilities
Not every metric needs second-by-second updates. Choose the refresh frequency according to business urgency and avoid investing in expensive streaming infrastructure when scheduled processing would meet the requirement.
Underestimating Integration and Maintenance Costs
Integration work can involve inconsistent data, legacy systems, rate limits, and authentication challenges. Budget for testing, monitoring, upgrades, and ongoing support rather than considering only the initial development effort.
Neglecting Security and Access Controls
Dashboards can consolidate sensitive information from multiple systems, making them attractive targets for unauthorised access. Implement appropriate authentication, server-side permissions, secure secrets management, and audit logging.
Building Without Validating User Needs
A dashboard designed without user feedback may present the wrong metrics or require too many steps to answer common questions. Involve representative users in requirements discovery, prototyping, and acceptance testing.
Failing to Measure Adoption and ROI
A dashboard that is rarely used may deliver little value, even if it functions correctly. Track active usage, reporting time saved, data quality improvements, and other outcomes connected to the original business case.
Build vs Buy: A Final Decision Framework for Business Leaders
Business leaders can evaluate the decision using five criteria.
Business Differentiation and Customisation
If the dashboard is central to a differentiated product or supports proprietary workflows, custom development may provide strategic value. If it is primarily an internal reporting utility with standard requirements, buying may be more efficient.
Integration and Data Complexity
A platform with reliable connectors for all required systems is a strong candidate for purchase. Complex legacy integrations, specialised calculations, and unique data-processing requirements may favour custom or hybrid development.
Speed to Market
An existing platform may be preferable when the business needs a usable solution quickly. Custom development may be justified when the additional time is necessary to support capabilities that existing products cannot provide adequately.
Total Cost of Ownership
Compare development or configuration, subscriptions, infrastructure, maintenance, support, and migration costs over the same period. Include realistic assumptions about user growth, data volume, and future requirements.
Long-Term Control and Scalability
Consider who controls the roadmap, how the solution can be extended, and what happens if a vendor changes its pricing or product features. Custom development offers more control over custom components, but it also creates ongoing maintenance responsibilities. The best decision is the one that meets business requirements with an acceptable balance of cost, risk, flexibility, and time to value.
How to Choose a Custom Dashboard Development Partner
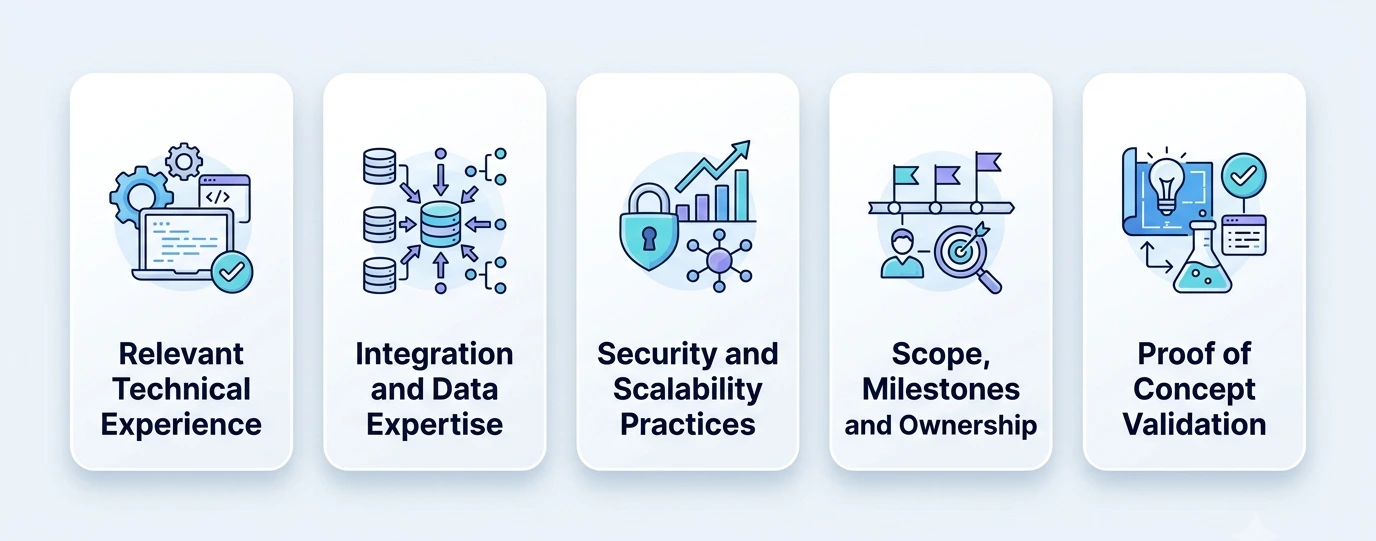
Selecting the right development partner is essential for building a reliable, scalable dashboard. RipenApps helps businesses evaluate technical requirements, plan integrations, and align development milestones with business goals, with a focus on transparent communication and long-term value.
Review Relevant Experience
Ask whether the team has experience building dashboards, integrating enterprise systems, designing data pipelines, and deploying cloud-based application types. Relevant experience should include examples of the problems solved, not just a list of technologies used.
Assess Integration and Data Engineering Expertise
A development partner should understand API integrations, data transformation, database design, data validation, and failure recovery. Ask how the team would handle unavailable source systems, inconsistent records, and delayed updates.
Evaluate Security and Scalability Practices
Discuss authentication, access controls, encryption, monitoring, backup strategies, and performance testing. The partner should be able to explain how the proposed architecture supports the expected workload and how it can evolve as requirements change.
Confirm Scope, Milestones, and Ownership
The proposal should identify deliverables, assumptions, dependencies, acceptance criteria, and ongoing support responsibilities. Clarify ownership of source code, documentation, configurations, and any custom components.
Start with a Proof of Concept When Necessary
If the main uncertainty concerns data access, performance, or a complex integration, a limited proof of concept may help validate the approach before a larger investment. A phased implementation can also reduce risk by delivering core functionality before adding advanced capabilities. Businesses planning the surrounding cloud environment can also explore cloud application development services to understand the broader application and infrastructure capabilities that may support the solution.

Conclusion
Custom dashboard development can help businesses turn fragmented data into a more consistent and actionable view of performance. However, the right solution is not necessarily the one with the most features or the most advanced architecture.
Business leaders should first establish which decisions the dashboard must support, which KPIs matter, and how quickly the underlying information needs to be updated. These requirements determine whether a standard platform, a custom application, or a hybrid model is most appropriate.
Real-time cloud architecture should be designed around actual operational needs. Batch processing may be sufficient for scheduled financial reporting, while streaming and event-driven systems can support more time-sensitive workflows. Security, data quality, reliability, and ongoing operating costs must be considered alongside performance.
The financial evaluation is equally important. A realistic business case compares total cost of ownership over a defined period and measures benefits such as reporting time saved, reduced errors, and improved operational efficiency. ROI assumptions should be transparent and based on outcomes the organisation can reasonably measure.
For companies planning a tailored dashboard, partnering with a web design development company like RipenApps can help create an intuitive user experience backed by a focused MVP, reliable integrations, and a clear monitoring strategy. By aligning design, functionality, cloud architecture, and business objectives, organisations can build dashboards that simplify complex information, support better decisions, and deliver sustainable value as their needs evolve.
FAQs
1. How much does custom dashboard development cost?
Custom dashboard development can range from a few thousand dollars for a basic reporting interface to significantly more for an enterprise-grade solution. The cost depends on the number of integrations, complexity of data processing, user roles, security requirements, and real-time capabilities. Businesses should also budget for cloud infrastructure, maintenance, monitoring, and support rather than comparing initial development quotes alone.
2. Is it better to build a custom dashboard or buy an existing platform?
Buying is generally suitable when reporting requirements are standard and existing platforms support the necessary integrations. Building is worth considering when the business needs specialised workflows, proprietary KPIs, complex integrations, or greater control over the user experience. A hybrid approach can combine an established analytics platform with custom data pipelines or application components. The decision should be based on requirements, total cost of ownership, and long-term objectives.
3. What technology stack is best for real-time cloud dashboards?
The appropriate stack depends on data volume, update frequency, expected traffic, security requirements, and team expertise. A solution may combine a web frontend, backend APIs, a relational database or analytical warehouse, and cloud-based processing services. Event streaming may be appropriate for time-sensitive updates, while scheduled processing can meet less urgent reporting needs. The architecture should be selected after defining performance and data freshness requirements.
4. How long does it take to develop a custom business dashboard?
A basic dashboard may take several weeks, while a more complex solution can require several months or longer. The timeline depends on requirements discovery, data availability, integration complexity, interface design, security, testing, and deployment. Projects involving legacy systems or real-time processing may need additional validation. A phased MVP approach can help businesses deliver essential reporting functionality before expanding the dashboard.
5. How do you measure the ROI of a business dashboard?
Measure ROI by comparing the dashboard’s costs with its verified financial benefits over a defined period. Benefits may include reduced manual reporting hours, lower reconciliation costs, fewer measurable errors, and improved operational efficiency. Subtract recurring expenses from annual benefits, then account for the initial investment. Establish a baseline before implementation, track results after launch, and avoid counting the same benefit more than once.
6. What security features should a custom business dashboard include?
A secure business dashboard should include role-based access control, multifactor authentication where appropriate, data encryption, secure API integrations, and audit logging. Businesses should also implement session management, regular vulnerability testing, and monitoring for suspicious activity. Security controls must align with the sensitivity of the data and applicable compliance requirements.
7. Can a custom dashboard integrate with existing business systems?
Yes, custom dashboards can integrate with existing business systems such as CRM platforms, ERP software, accounting tools, cloud databases, and third-party APIs. Integration methods depend on the systems’ capabilities and may include APIs, webhooks, database connections, or scheduled data transfers. Proper integration planning helps maintain data accuracy, consistency, and timely reporting across business operations.
Discuss your project and request for proposal
SHARE
WRITTEN BY

Ishan Gupta
CEO & Founder
Ishan Gupta is a seasoned entrepreneur and CEO with extensive 10+ years of experience in business and mobile app development landscape. He believes that the right digital product allows companies to focus on what they do best, while technology handles the rest. With deep exposure to global markets, he understands what makes an app succeed. His approach translates business needs into clear product strategies, ensuring that every feature contributes to measurable ROI.
View All Articles